

select search filters
briefings
roundups & rapid reactions
Fiona fox's blog
A preprint, an unpublished non-peer reviewed study, reports on the latest data from the REACT-1 study on COVID-19 spread across England.
This Roundup accompanied an SMC Briefing.
Prof Sheila Bird, Formerly Programme Leader, MRC Biostatistics Unit, University of Cambridge, said:
“REACT-1 has observed its highest-ever weighted prevalence of swab-positivity in round 15a (1.7%, 95% CI 1.6% to 1.8% during 19 to 29 October 2021); a doubling when compared to 0.83% (0.76% to 0.89%) in 9-27 September 2021 (round 14). Swab-positivity rates were particularly high, around 6%, in persons under 18 years of age who, as yet, are less protected by immunization and experienced fewer harm-reduction measures on their return to school in England.
“At the regional level, there was an almost 4-fold increase in the weighted prevalence in the South West: up from 0.6% (95% CI: 0.4% to 0.8%) in round 14 to 2.2% (95% CI: 1.8% to 2.6%) in round 15a.
“REACT-1 therefore poses the question: did false reassurance on account of the IMMENSA laboratory’s incorrect PCR-adjudications – during September through to 8 October 2021 – of positive lateral flow tests, predominantly but not exclusively in the South West, contribute to onward transmission to such an extent that the fall-out has been picked up by REACT-1. Or, is there another explanation.
“REACT does not operate in Wales. But Wales also sent PCR-swabs to the Wolverhampton laboratory and so we cannot look to Wales for corroboration – except perhaps via the ONS Community Infection Survey which does run in Wales.
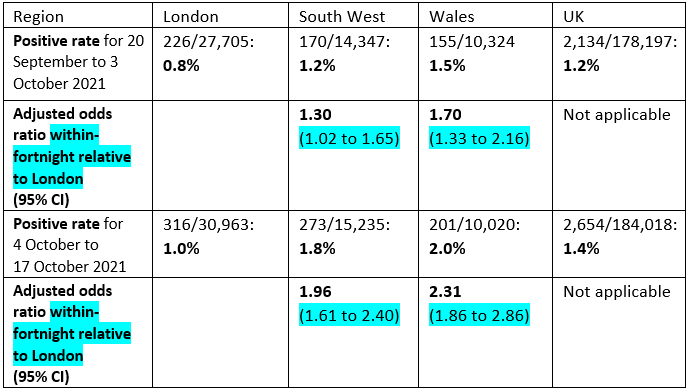
“Today’s report on the ONS Community Infection Survey relates to 4 to 17 October 2021: overall, 2,654/184,018 tests were positive (1.4%). Table 3a reports the modelled likelihood of testing positive for COVID-19 having adjusted for demographic characteristics. In terms of geography, London is the reference (316 positives out of 30,963 tests or 1.0%). The South West (273 positives out of 15,235 tests or 1.8%) and Wales (201 positives out of 10,020 tests or 2.0%) have the highest adjusted odds ratios of 2.0 (95% CI: 1.6 to 2.4) and 2.3 (95% CI: 1.8 to 2.9).
“However, to mimic the REACT analysis, I really need to find the corresponding analysis table for earlier in September. Strictly also, I should (but can’t) take into account that the ONS Community Infection Survey returns to a modestly refreshed cohort fortnight by fortnight rather than a de novo sample as in REACT. I have not found an earlier analysis table than for 20 September to 3 October 2021 and so here are the unadjusted positive-rates and, more importantly, the adjusted odds ratios relative to London for the earlier & later fortnight: significantly greater for the South West (50% increase) in the second fortnight; and increased also for Wales (36% increase) but less dramatically.
“We are now more than 4 weeks since a stop was put on PCR-testing by the IMMENSA private laboratory in Wolverhampton – at least until for their incorrect conduct/interpretation of PCR-testing was resolved. The period of concern has been well-defined but not well-explained in the public domain. Nor have the lessons to be learned been yet set out – training on new techniques, intra- laboratory controls, inter-laboratory quality assurance comparisons, and analytical surveillance on laboratory-performance. How long can it take to do this?
“Setting the record straight surely includes at least documentation per region in England and for Wales of Pillar 2 PCR-testing as follows:
“Together, these counts and their associated PCR-positive rates, especially if positive-rates are also covariate-adjusted (as REACT routinely presents and as ONS CIS has done recently), would help to know which regions of England (other than the South West) were caught up in the Wolverhampton debacle and to what extent – relative to the South West.
The REACT-team conducts and reports its surveillance in a shorter period than the public has waited for explanations about why PCR-testing went awry at a Wolverhampton laboratory and how quickly the problem was picked up on. The public and journalists were certainly on the ball.”
Prof Kevin McConway, Emeritus Professor of Applied Statistics, The Open University, said:
“This interim report from the REACT-1 team based at Imperial College covers only the first part of their latest round of swab tests, round 15, from about 67,000 swabs taken between 19 and 29 October. So there will be more information from this round coming later, after it is complete and all the data have been analysed. Unlike the ONS Covid-19 Infection Survey (CIS), which runs continuously, REACT-1 runs in separate rounds. The previous round ran from 9 to 27 September – so there was quite a gap between round 14 and the new results, during which time the prevalence of positive tests in England rose by about half, according to the estimates from the CIS statistical model.
“It’s therefore not surprising that these new REACT-1 results also show a considerable increase in the estimated percentage of people in the English community population who would test positive between round 14 and the first part of round 15. In fact the REACT-1 estimates have gone up rather faster than the CIS estimates. It’s difficult to be precise about the numbers, partly because this new REACT-1 preprint covers data obtained right up to 29 October, while the most recently published CIS estimates go up only to 22 October. (There will be more CIS results, probably taking the estimates up to 29 October, on Friday this week.)
“I commented on the previous REACT-1 preprint that there was quite a difference between the REACT-1 and the CIS estimates of the proportion of the population who would test positive back in September. The REACT-1 estimates were lower than the CIS estimates then. That discrepancy isn’t necessarily a problem – it’s good that there are two surveys running in England so that we can compare the results. But the reasons for it weren’t clear, not to me anyway. However, it looks as if the discrepancy may have gone away for the latest REACT-1 part-round. The average CIS daily estimate for 19-22 October, which is so far the only period of REACT-1’s round 15 for which we have CIS estimates, is that 2.11%, or about 1 in 50, would test positive. That’s higher than the REACT-1 estimate of 1.72% or about 1 in 60 for the whole period 19-29 October included in today’s preprint – but it’s not all that much higher, and the daily figure for the separate days of this REACT-1 round show similar figures to CIS for the first few days of the REACT-1 round, followed by a fall for later days in the round. When we see the latest CIS results on Friday, they might or might not show a similar fall. So I’m less concerned about any differences in estimates between the two surveys than I was in September.
“Indeed, quite a lot of what’s reported in this new REACT-1 preprint does match what has been seen in other sources. But that certainly doesn’t mean that REACT-1 is not needed. In this interim report, the REACT-1 researchers point out that it’s possible that their results do not match the true position in the English population, despite their careful sampling and their adjustment of the results to try to take account of any remaining unrepresentativeness of the sample, partly because the response rate (the proportion of people who agree to take part, when asked) has been falling. It’s appropriate (and refreshingly honest) for them to say that – but those points apply to most surveys, and so to the CIS as well (in different ways), so it’s excellent that we have both surveys and can compare the results. Given that there are some quite important differences between the ways these two large surveys choose their samples of people to be swabbed and analyse the data, the fact that they do generally give fairly similar results does add some confidence that they are representing reasonably well what’s really going on in the country.
“As always, this REACT-1 preprint provides estimates of the rate of testing positive for many subgroups of the population, though because it covers only part of the latest round, many of those estimates are subject to a great deal of statistical uncertainty and can’t yet tell us much. They do, however, make it extremely clear that the age groups who are, by far, most likely to test positive for the virus are those aged 5-12 and 13-17. For those groups, the REACT-1 researchers estimate that 5.85% and 5.75%, respectively, would have tested positive on any day between 19 and 29 October. That’s about 1 in every 17 children in those age groups. The most recent CIS estimates for similar age groups are also very high – indeed overall rather higher, though it’s difficult to be precise because CIS uses different age groups and covers a slightly different period. It’s also known from numbers of new confirmed cases on the dashboard at coronavirus.data.gov.uk that infection rates are very high in these school-age groups compared to older ages. The positivity rates from REACT-1 are also higher than average in the sort of age groups that might well have children of school age (35-44 and 45-54), and the researchers point out that having one or more children in the home was generally associated with a higher than average chance of testing positive. So they are concerned that infections in other age groups are being driven by the high rates in school-age children, and they express a hope that increased vaccinations in children over 12 will limit transmission and so bring down infection rates generally. I certainly agree with that hope.
“It looks like good news that the REACT-1 preprint shows a pattern of falling infection rates over the period covered by the first part of round 15 – but there are reasons to be cautious about that. First, the pattern in the REACT-1 results is based on daily estimates of the number of swabs testing positive, and there’s quite a lot of uncertainty in those estimates, because the number of swabs that test positive on any single day isn’t very large. Second, although there have also been falls in the numbers of new confirmed cases on the dashboard, for England, over the period covered by this REACT-1 round, the patterns in dashboard figures don’t necessarily match what goes on in REACT-1 (or other surveys such as CIS). That’s because the dashboard figures are based on routine testing and there can be biases if the numbers and types of people being tested change. It’s also because those new confirmed cases are new infections, while what’s measured in REACT-1 is the numbers who would test positive, regardless of whether their infection is new or has been going on for some time.
“But, most importantly in my view, the REACT-1 researchers give a warning that there’s no way to be confident that the declining infection rate will continue. It’s quite a short-term decline, only lasting just over a week so far, and roughly coincides with the school half-term holidays, when the ways and amounts that people meet others are different from during term-time so that transmission of the virus is likely to be different. The researchers point out that there was a fall followed by a rise in infections approximately a year ago – even though conditions were very different then (no vaccination, more restrictions of various sorts), the same pattern could happen again. They are not saying that it will definitely happen again, but they are right to point out that we have to be aware that that is possible, and plan accordingly for what to do if it does occur.”
Dr Stephen Griffin, Associate Professor in the School of Medicine, University of Leeds, said:
“This latest analysis by the REACT team shows the highest prevalence of SARS-CoV2 that has ever been witnessed in the UK. This is predominantly amongst under 18s. I can only vigorously agree with the conclusions in the manuscript that vaccination in over 12s, with extension to 5-11, should be an absolute priority to prevent transmission, disruption in schools and incidence of severe disease amongst those infected. During the interim period, it seems ludicrous to not introduce mitigations in schools. This is not something to be ignored, no matter how desperately we all want to return to normality; the bitter irony in doing so is that it will make normal all the more difficult to regain in the longer term. We must protect young people from this virus, I urge the MHRA and JCVI to prioritise their assessment of the vaccine for under 12s.”
The preprint ‘REACT-1 round 15 interim report: High and rising prevalence of SARS-CoV-2 infection in England from end of September 2021 followed by a fall in late October 2021’ by Marc Chadeau-Hyam was posted online at 00:01 UK time Thursday 4th November. This work is not peer-reviewed.
All our previous output on this subject can be seen at this weblink:
www.sciencemediacentre.org/tag/covid-19
Declared interests
Prof Sheila Bird: “SMB is a member of the Royal Statistical Society’s Working Group on Diagnostic Tests and of RSS’s COVID-19 Taskforce.”
Prof Kevin McConway: “I am a Trustee of the SMC and a member of its Advisory Committee. I am also a member of the Public Data Advisory Group, which provides expert advice to the Cabinet Office on aspects of public understanding of data during the pandemic. My quote above is in my capacity as an independent professional statistician.”
Dr Stephen Griffin: “No COI.”