

select search filters
briefings
roundups & rapid reactions
Fiona fox's blog
Scientists react to Winter COVID-19 infection study data released by UKHSA and ONS.
Prof Paul Hunter, Professor in Medicine, UEA, said:
“One of the most valuable surveys done during the pandemic was the ONS covid infection survey which sampled up to about 200,000 people every other week and provided some of the best estimates of how many people were infected at any one time, whether or not they had symptoms https://theconversation.com/the-ons-has-published-its-final-covid-infection-survey-heres-why-its-been-such-a-valuable-resource-202589. This survey was suspended last March but has been restarted in collaboration with the UKHSA just for the winter months.
“Today the first results of the new survey have been published https://www.gov.uk/government/statistics/winter-coronavirus-covid-19-infection-study-estimates-of-epidemiological-characteristics-england-and-scotland-2023-to-2024.
“The first thing to point out is that these estimates are prevalence estimates (i.e. the proportion of people who would test positive and NOT the number of new infections which will be about 10 fold lower).
“It is no surprise that prevalence has been increasing since the last week of November as all the other indicators including hospital admissions and tests reported have also been showing this increase. It was expected that infections would rise towards the end of the year. But what the other indicators do not do is tell us how many people are currently infected with the virus. That is the value of this latest data.
“What we didn’t know before is whether covid infections are more or less common than the same time last year and the year before that (figure 1). You can see that up till the end of November, infection rates were pretty much the same as the same time period in the previous two years. Since the start of the month infections this year have increased more than in previous years and by the 13th December were about 50% higher than last year (see figure 1).
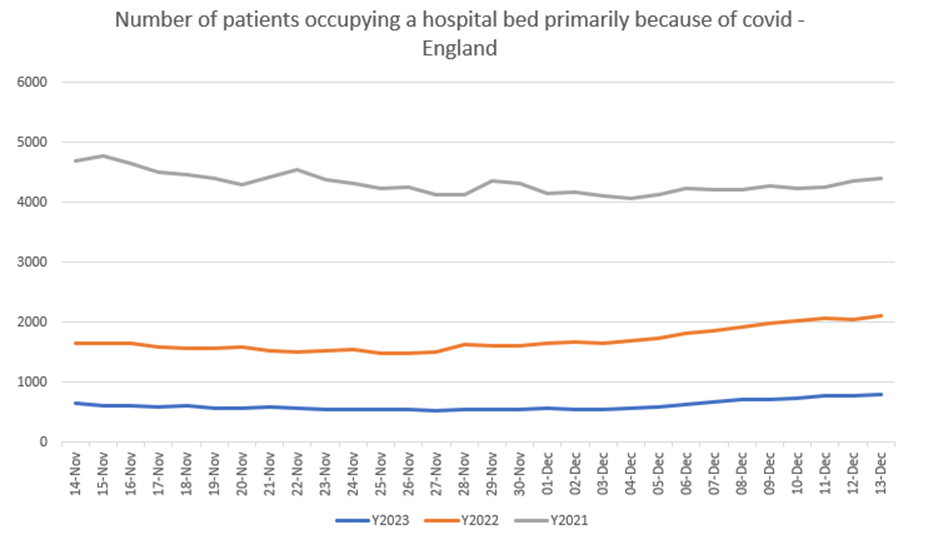
“But that is not the full story. Are covid infections causing as much harm as in previous years. The answer is no as measured by the number of people occupying hospital beds primarily because of covid. So although infections are higher this year than last they are putting less than half the patients in hospital (Figure 2). So on average someone catching covid this year is a lot less likely to end up in hospital because of it than last year and substantially less than in 2021.
“The uncertainty is how high infections will go and when they will peak. Although a covid infection is much less likely to put you in hospital than a year ago, if infection rates go very high then this will put pressure on the NHS. Unfortunately it is too early to know this. I suspect that covid infections will peak early in January and hospital beds take up still won’t be as high as last year by a significant margin, though we can’t know that for certain.
“Furthermore, covid is not the only issue. In this week’s influenza report National Influenza and COVID-19 surveillance report https://www.gov.uk/government/statistics/national-flu-and-covid-19-surveillance-reports-2023-to-2024-seasoninfluenza infections are also increasing rapidly. The hospitalisation rate for influenza are close to the that of covid and are increasing more rapidly so may soon overtake that from covid.”
Figure 1
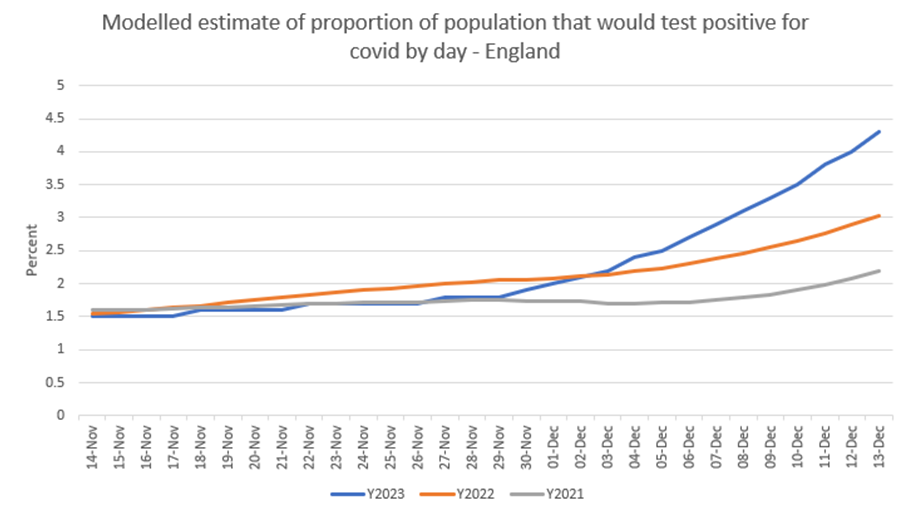
Figure 2
Prof Kevin McConway, Emeritus Professor of Applied Statistics, Open University, said:
“What does the new Winter Coronavirus (COVID-19) Infection Study (WCIS) tell us about Covid infections in the UK? Well, the news isn’t very encouraging at present, at least not for England and Scotland. (The study doesn’t run in Wales or Northern Ireland.) But it’s a new study, and there’s still considerable uncertainty about some of the details.
“Publication of the WCIS results is, not very helpfully, split between ONS (Office for National Statistics) and UKHSA (UK Health Security Agency). I say more about the exact sources in a note at the end.
“I think that the most informative source of information comes from UKHSA. For the first time today, they have published results from their statistical modelling of the survey data produced by ONS. These UKHSA results use a statistical model that ‘weights’ the data to allow for the characteristics of the sample of people providing the data not being the same as the characteristics of the population in private households, and that also allows for possible errors in individual test results. (That is, false positives, where someone tests positive but is not in fact infected, and false negatives, where someone tests negative, but is in fact infected.)
“The most recent data, for both the ONS and the UKHSA publications, is for 13 December, just over a week ago. There is always some delay in survey findings like these, because of the time taken to collect in the latest data and to analyse it statistically.
“UKHSA estimate that about one in every 24 people, aged over 2 and living in private households in England and Scotland, was infected with Covid-19 on 13 December. That’s an increase of about 56% in the proportion of people infected, compared to their estimate for one week earlier. This indication of quite a substantial increase is consistent with the unweighted data from ONS (increase of 57% from the week ending 6 December to the week ending 13 December). It’s also broadly consistent with indications of increase in hospitalisations involving Covid and with other data collated by UKHSA (for England) in their weekly surveillance bulletins, though the detailed numbers are not the same.
“As always with results based on surveys and statistical modelling, there’s some statistical uncertainty about this – the data are consistent with the number of infected people being anywhere between 1 in 19 and 1 in 30. There may also be other aspects of uncertainty that couldn’t be allowed for in these calculations – but there’s little doubt that infection rates have been increasing since late November.
“This is a prevalence estimate – an estimate of the number of people who have a Covid infection on 13 December, whether they were first infected on that day, or had been infected already for a few days (or longer). UKHSA say they are planning to publish incidence results too, estimating the number of new infections on a given day, but they can’t do that yet on the basis of the data they have so far.
“UKHSA also produce separate prevalence figures for England (again 1 in 24 infected, with uncertainty interval from 1 in 19 to 1 in 30), and Scotland (again about 1 in 24 infected, with uncertainty interval from 1 in 18 to 1 in 33).
“There are results also for separate age groups and for different regions of England.
“For age groups, the highest prevalence of infection (for England and Scotland together) on 13 December was for ages 18 to 34, and 35 to 44, with in both cases about 1 in 17 people infected. There’s quite a lot of statistical uncertainty, though, because the numbers of people tested in these age groups is smaller than for all ages. For the 18 to 34 group, for instance, the true number could plausibly be anywhere between 1 in 13 and 1 in 24.
“For other age groups, the estimates are lower, particularly for the oldest group considered (75 and over) where UKHSA estimate that about 1 in 50 had an infection on 13 December, with an uncertainty interval from 1 in 38 to 1 in 71. But rates have increased in all age groups since late November.
“For the English regions, the estimated prevalence of infection has increased in all of them over the two weeks to 13 December, but particularly in London (estimated 1 in 16 infected on 13 December, uncertainty interval from 1 in 12 to 1 in 22) and in the South East (estimated 1 in 21 infected, uncertainty interval from 1 in 16 to 1 in 28), and to a rather smaller extent in the East of England (estimated 1 in 23 infected, uncertainty interval from 1 in 17 to 1 in 30). In all the other regions the estimate of prevalence for 13 December is between 1 in 26 and 1 in 29, though with quite wide uncertainty intervals.”
Further information
“Now some background, partly to explain why it is a bit early to be entirely confident about these results. They are all flagged as ‘official statistics under development’, which means that they are still being tested with users and that the details may change.
“During the heights of the Covid pandemic we were rather overwhelmed with data on how many people in the UK were getting infected, getting ill, going to hospital and, sadly, dying. It could be difficult to make sense of all that, and some data sources weren’t very reliable for various reasons.
“But one generally acknowledged statistical strength was the ONS Coronavirus Infection Survey (CIS). Unlike other sources of information on how many people were infected, it used data from a reasonably representative sample of the population, made sensible statistical adjustments, and generally gave a good picture of how infections were progressing.
“Surveys of representative samples, like the CIS, were extremely uncommon in other parts of the world. In England, we were lucky enough to have two of them – the other set were the REACT surveys based at Imperial College – which allowed us to cross check between the two.
“All that ended after March this year, when the funding for the CIS (and REACT) finished. But a new, somewhat similar, survey began to publish results two weeks ago. This is the Winter Coronavirus (COVID-19) Infection Study (WCIS), a joint piece of work by UKHSA and the ONS. The publication two weeks ago did not include the weighted results from the modelling undertaken by UKHSA.
“It’s not really possible to compare the prevalence results from the old CIS with those from the new WCIS. That’s for several reasons, one main one being that the old survey (and also the REACT survey) used data from PCR tests, whereas the new WCIS uses data from lateral flow tests sent to the participants. The characteristics of the two types of test are not the same. UKHSA are aiming to allow for the error rates of the lateral flow tests in their statistical modelling, but it can’t yet really be clear how well this is working.
“Also, there will be differences between the way people are chosen to provide samples for the old and the new surveys, and in the statistical model used (by UKHSA for the new survey) to produce the weighted results. Details on exactly what is being done are a bit sparse so far – a publication on the methodology is promised for next month, and we’ll know more then. I can say at the moment that the general approach in the statistical modelling seems appropriate and fairly standard, and is, in broad terms anyway, the same as was used with the CIS. But the devil can be in the detail, and we haven’t seen the detail yet.
“The old CIS didn’t exist in isolation – there was also (for England) the REACT survey, with similar but certainly not identical methods, and there was also data based on routine testing and published on the Government dashboard, and results produced by a very different methodology from the ZOE study.
“But now, REACT no longer runs. The dashboard figures were always subject, from time to time, to changes produced because more, or fewer, or different, people were choosing to be tested, or because of changes in the availability of tests, and not because of real underlying changes in infection rates. Since free routine testing has mostly ended, the figures from that source are less reliable than they were. The ZOE study was never as completely open about its methods, and although it still publishes Covid estimates, that are probably based on fewer responses from volunteers, and it’s not clear (to me anyway) how reliable they are.
“So with the old CIS, we could gain some confidence in its findings by seeing that, in broad terms, it was moving similarly to all these other sources of data, which it generally was. That just can’t be done now, not in the same way at least.
“Therefore I can’t yet be confident that the new results from the WCIS are entirely reliable. The people involved do know what they are doing, and what they are doing sounds broadly acceptable to me. But I think we need to giver a longer time, for the methods to settle down and possibly to be adjusted where necessary. That will happen – though probably not in time for the next data release, which will be on 11 January (with another promised for 18 January and then fortnightly after that).”
Sources
“Note that all this is still very new to me too – if I’ve missed or misrepresented an important data source, please let me know. (kevin.mcconway@open.ac.uk)
“The UKHSA publications associated with the WCIS are linked from https://www.gov.uk/government/statistics/winter-coronavirus-covid-19-infection-study-estimates-of-epidemiological-characteristics-england-and-scotland-2023-to-2024. Something similar to the information that used to be in the weekly ONS CIS bulletins is at https://www.gov.uk/government/statistics/winter-coronavirus-covid-19-infection-study-estimates-of-epidemiological-characteristics-england-and-scotland-2023-to-2024/winter-coronavirus-covid-19-infection-study-estimates-of-epidemiological-characteristics-21-december-2023, though, in this first publication at least, it doesn’t give so much of the helpful interpretation that used to be in the CIS bulletins. There is also a document explaining what and where all the publications are, https://www.gov.uk/government/statistics/winter-coronavirus-covid-19-infection-study-estimates-of-epidemiological-characteristics-england-and-scotland-2023-to-2024/winter-coronavirus-covid-19-infection-study-publications-explained, and there’s rather brief publication on methodology and quality, and a spreadsheet version of the numbers used in the explanatory report.
“The UKHSA publications explain that, from some time in early 2024, they hope to publish estimates of incidence, that is, the numbers of people each day or each week who are newly becoming infected. The current results are for prevalence, that is, the numbers of people who are currently infected, regardless of whether they were first infected on the day in question or have already had an infection for some days (or longer). UKHSA also say that they may in future publish data on the risk of being hospitalised if one is infected, the risk of death after being infected, and possibly other things. But none of this can be available yet when there is still too much uncertainty about aspects of the data and of the statistical modelling.
“The ONS data release on the WCIS is at https://www.ons.gov.uk/peoplepopulationandcommunity/healthandsocialcare/conditionsanddiseases/datasets/wintercoronaviruscovid19infectionstudyenglandandscotland. There is no explanatory bulletin, just some notes and usage information and a link to a spreadsheet containing the results. These results are estimated percentages of people in England and Scotland (together and separately) who would test positive, but without statistical weighting to allow for differences between the sample of people who provided the data and the known characteristics of the population.
“The old Government coronavirus dashboard at https://coronavirus.data.gov.uk/ is still available, though it has for a long time been confined to providing data for England and it is even longer since it was updated daily, as it used to be. However, today it says that it had its final update on 14 December, and that after 21 December we should instead use the UKHSA data dashboard.
“The UKHSA data dashboard is at https://ukhsa-dashboard.data.gov.uk/. However, at the time of writing this (12.30 on 21 December 2023), this new dashboard still says “As the UKHSA data dashboard is still undergoing statistical review, do not use the dashboard data.” Instead it tells us to use the old dashboard, and the weekly UKHSA surveillance report. Presumably this will all be updated at some point soon. The UKHSA dashboard presents data on some other respiratory viruses as well as Covid-19. That will be very useful, if and when it gets beyond the stage of telling us not to use it.
“UKHSA’s weekly surveillance reviews, linked from https://www.gov.uk/government/statistics/national-flu-and-covid-19-surveillance-reports-2023-to-2024-season, present data on influenza, Covid-19, some other respiratory diseases, and on what is known as ‘influenza-like illness’ (ILI), a term for illnesses that have some of the characteristics of influenza but which may or may not actually be caused by an influenza virus. Because it puts together data from a variety of different sources, it can present a pretty comprehensive version of what is going on. But it applies only to England. Similar surveillance goes on in the other UK countries, and is published by their health authorities.”
https://www.gov.uk/government/news/ukhsa-and-ons-release-latest-winter-covid-19-infection-study-data
Declared interests
Prof Paul Hunter: “I have no conflicts of interest.”
Prof Kevin McConway: “I am a Trustee of the SMC and a member of its Advisory Committee. My quote above is in my capacity as an independent professional statistician.”