

select search filters
briefings
roundups & rapid reactions
Fiona fox's blog
The Office for National Statistics (ONS) have released provisional counts of the number of deaths registered in England and Wales in the week ending 27 November 2020.
Prof Kevin McConway, Emeritus Professor of Applied Statistics, The Open University, said:
“It’s good news that, in the latest data release on death registrations in England and Wales from ONS, they report that the total number of deaths from all causes was lower in the most recent week (ending 27 November) than it was the week before that. The number of excess deaths – which ONS measure as the difference between deaths this year and the average number from the five previous years – has gone down too. But it’s probably more representative of the trends to say that the increase in weekly death registrations, that we’ve seen every week since the middle of September, has levelled off. The decrease is very small (79 deaths out of over 12,000 per week).
“The news isn’t all good either. The number of deaths is still running at 20% greater than the average from the past five years – that’s about 2,100 higher in the latest week. Deaths are above the 5-year average in all regions of England and in Wales, though less so in the south of England than in the north, the midlands, and Wales. And the number of registered deaths with a mention of Covid-19 on the death certificate, in deaths registered in the week ending 27 November, was 13% up compared to the previous week.
“I remain concerned about the general high level of deaths, though less so about the reported rise in deaths involving Covid-19. I’ll explain why. Having deaths running at 20% above the average would be concerning, whatever the cause. But there is more than one way to count numbers of registered deaths, and many more ways to count deaths involving Covid-19. With registrations, two dates are relevant: the date when the person actually died, and the date when the death was registered. There is a delay between the death and the registration of the death, which is usually quite short (a few days, or a week or two) but can in some cases be long. The main reporting in these ONS reports is based on the date the death was registered, though they do also release data based on the date when the deaths occurred. The data by occurrence date are in many respects more useful, because they are not affected by things like bank holidays that affect when registrations can be made – but the data from the most recent weeks will be disproportionately affected by delays in registrations. In the latest data, deaths by occurrence are given for weeks up to the week ending 27 November, and include deaths registered right up to 5 December, but the most recent numbers by date of occurrence will without doubt be revised upwards in future weeks as more registrations come in. They do show a decrease on the previous week, but not a very large one, and again the best brief description is that the recent rising pattern has levelled off. That’s what I would have expected – data from the ONS Infection Survey and daily case counts indicates that the number of infections peaked in early November, probably a few days after the second England lockdown began on 5 November. If someone, unfortunately, dies from Covid-19, on average that would be about three weeks after they were first infected, and three weeks after the peak of infections takes us into the most recent week of death registration data.
“I said it was more complicated with deaths connected to Covid-19. With registrations, the issue of whether to use the date of occurrence of death or the date when the death was registered still arises. Using date of occurrence, the numbers of deaths involving Covid-19 in the most recent week (ending 27 November) was slightly down on the previous week, though the decrease could well be entirely due to late registrations not having come in yet, and this doesn’t really contradict the increase in deaths involving Covid-19 when measured by date of registration. But there are also deaths as counted on the dashboard at coronavirus.data.gov.uk. These are counted in a different way – the main count is of people who die within 28 days of a positive test for Covid-19. I think that the data on registrations is likely to be more accurate, because it involves a doctor’s judgment, based on what he or she knows of the patient, about what caused their death. Various comparisons have been made, and currently the number of Covid-related deaths according to registrations is running slightly below the number reported on the dashboard for the corresponding date. The data based on people who tested positive does depend to some extent on who gets tested, though since testing became widely available in the late Spring, almost anyone who is so ill with Covid-19 that they unfortunately die is very likely to have been tested, and had a positive test. But the 28-day count will include a few people who died of something else rather than the Covid-19 for which they tested positive (though comparisons have shown that the numbers in this position are small). Back at the peak of the first wave, tests were not nearly so easily available, so that numbers measured by the 28-day after a positive test criterion were considerably below the numbers from death registrations. The numbers of deaths by the 28-day criterion fell between the weeks ending 20 and 27 November, but by a fairly small amount, about 9%% (for England and Wales taken together), while the number of Covid-related deaths from registrations rose by 13% between those weeks when measured by registration date, and fell by about 3% when measured by date of death. What this tells me is that there’s more than one way to count a death as being linked to Covid-19, that whether the numbers are rising or falling depends on the definition and method of counting, but most importantly, that none of these changes for the most recent week are very large, and again it’s probably best to say simply that the numbers are changing rather little in either direction. That’s good news given the rises that we’ve seen for several weeks past. And it’s what I would have expected given the date of the peak in infections and the likely lag between someone being infected and death, if that unfortunately occurs.
“I must mention yet again that the number of deaths (from any cause) in people’s own homes is running above the average of the last five years – nearly 1,000 above average yet again in the most recent week. Most of these deaths do not have a mention of Covid-19 on the death certificate. I still have no clear idea of why this is.”
Prof Sheila Bird, Formerly Programme Leader, MRC Biostatistics Unit, University of Cambridge, said:
“Provisional counts of deaths which mention COVID-19 by date of occurrence are the key data. They show a slowing down of the rate of increase of deaths in November. But not yet a peak in England and Wales. Please, let us not relax our guard in December 2020. There are lives to save.
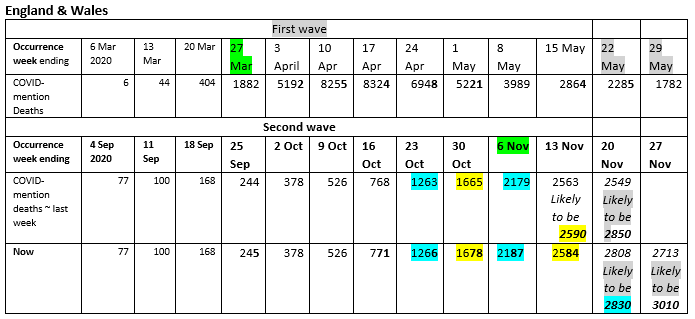
“My table, updated from last week, shows COVID-mention deaths in England & Wales (by week of occurrence) from early September to end November 2020. The cumulative 2nd wave total of COVID-mention deaths that have occurred by 27th November is 15,800 (to the nearest 100).
“Not all deaths which occurred in the week ending 27 November 2020 have yet been registered. Taking registration delay into account, we can expect that 3,010 COVID-mention deaths may have occurred in England & Wales in the week ended 27 November 2020, see Table.
“This week gives further support for a slowing down of the rate of increase in COVID-mention deaths when registration delay is adjusted for. Happily, the most recent fortnightly multipliers in turquoise (2830/2187 = 1.29) and yellow (2584/1678 = 1.54) are decreasing. If the yellow multiplier had continued to apply, we’d expect around 3980 COVID-mention to have occurred in the week ending 27 November. But, using registration-day as the basis for estimation, we are noticeably lower at 3010. But, COVID-mention deaths in Wave 2 have not yet peaked and so we must be especially on-guard in December.”
Dr Simon Clarke, Associate Professor in Cellular Microbiology, University of Reading, said:
“In two and a half weeks time, an extra 3000 families won’t be celebrating Christmas with a loved one, due to Covid-19. These latest ONS data represent the peak (week ending 27th November) of the deaths for the second wave of Covid-19 in the UK, a figure not seen since mid-May. A quarter of all deaths in England and Wales involved Covid-19. More recent government data suggest that while these numbers are declining, they are doing so slowly and we may expect something in the region of 280 Covid-19 deaths per day by the time the restrictions are lifted for Christmas.”
Prof Sir David Spiegelhalter, Chair, Winton Centre for Risk and Evidence Communication, University of Cambridge, said:
“In the week ending November 20th, there were 12,456 deaths registered in England and Wales, compared to a five-year average of 10,357.
“This is an excess of 2,099, a 20% increase over the five-year average. These are extra deaths that would not normally have occurred, and substantially larger than any excess in the last 10 years, even in very bad flu years.
“3,040 deaths had Covid on the death certificate. 87% of the Covid deaths were deaths ‘from’ Covid as the main underlying cause, so only 1 in 8 were deaths ‘with’ Covid as a secondary cause.
“In contrast, there were only 285 death with flu or pneumonia as the main cause of death, so Covid is currently causing more than 9 times the number of deaths than flu or pneumonia.
“Between September 5th and November 27th, 16,280 deaths involving Covid were registered in the UK, so by now there will have been around 20,000 Covid deaths in the second wave, compared to 57,000 up to September.”
https://www.ons.gov.uk/peoplepopulationandcommunity/birthsdeathsandmarriages/deaths/bulletins/deathsregisteredweeklyinenglandandwalesprovisional/weekending27november2020
All our previous output on this subject can be seen at this weblink:
www.sciencemediacentre.org/tag/covid-19
Declared interests
Prof Kevin McConway: “I am a Trustee of the SMC and a member of the Advisory Committee, but my quote above is in my capacity as a professional statistician.”
Prof Sheila Bird: “I am a member of the Royal Statistical Society’s COVID-19 Taskforce.”
Prof Sir David Spiegelhalter: “DJS is a paid non-executive director of the UK Statistics Authority, that oversees the work of the ONS.”
None others received