

select search filters
briefings
roundups & rapid reactions
Fiona fox's blog
The Office for National Statistics (ONS), have released the latest data from their COVID-19 Infection Survey.
Prof Rowland Kao, Professor of Veterinary Epidemiology and Data Science, University of Edinburgh, said:
“It is true that the ONS survey is somewhat delayed, these figures representing infections picked up in early October, and therefore infections occurring on the order of several days to a week before that. However the same is true of hospitalisations, as the delay until seriousness illness is of course usually at least several days to when infection can be picked up by testing, if not longer. Further, hospitalisations don’t really reflect the level of circulation anymore – as most who experience severe infection (and therefore more likely to go to hospital) are increasingly those with existing conditions, the elderly and especially those who have not been vaccinated. This demographic is more heavily weighted towards those in areas of high deprivation. The broader circulation across the community which the ONS survey reflects, is therefore to some extent picking up a more general picture of how SARS-CoV-2 (the virus itself) is being spread. It’s important to remember that while this also means that the hospitalisation figures are a more realistic representation of the course of the most severe impacts of COVID-19, long COVID is more and more in the news, of often serious long term impacts of getting COVID, even if it does not lead to hospitalisation.”
Prof Kevin McConway, Emeritus Professor of Applied Statistics, The Open University, said:
“Today’s release of estimates from the ONS Coronavirus Infection Survey (CIS) doesn’t make particularly happy reading. ONS say that the percentage of people who would test positive for Covid-19 increased in three of the UK countries over the most recent week for which estimates are available, though not in Scotland where the recent trend was said to be ‘uncertain’. That’s not good news. But should it be a major cause for concern? That’s less clear, in my opinion, though some aspects are more concerning than others.
“One important point is that, though the CIS estimates of the number of infected people in England have been increasing for the last four weekly bulletins, and though the same has been true in Wales (though less clearly so), the most recent estimated numbers of people who would test positive in both those countries have only got up to the levels of the end of July or the start of August, when infection levels were very far below the peaks we saw earlier in the year. We’ve seen before that, once infections rates start to increase, they can increase very rapidly – but that does not always happen. So yes, the increases are a cause for concern, but I still think it’s much too early to say that there is definitely going to be a major new wave.
“Another very important point is that the latest CIS estimates only go up to the week ending on 3 October in England, and only up to the earlier date of 29 September in the other UK countries. The figures really can’t be produced more quickly, given the various stages that have to be gone through in returning the swabs, testing them, and doing the necessary statistical calculations. But in a situation when we all want to know whether major increases in infection are likely to occur, these inevitable lags can be frustrating.
“As always, ONS provide figures for the different regions of England, and for separate age groups in England. These are not provided for the other three UK countries, because not enough people are swabbed for the survey there to allow reasonably precise estimates for subgroups of the population (by age or geography) to be made there.
“On the English regions, ONS consider that the latest trend in all regions except the North East is increasing. They regard the trend in the North East as ‘uncertain’, but there’s always less certainty about trends in that regions than in the others. That’s simply because it has the smallest population of the English regions and fewer people are tested there for the CIS, so the margin of statistical uncertainty is wider. In fact there is not much variation in the estimated proportion who would test positive between all the English regions now – the estimates range from 1 in 30 in the South West to 1 in 40 in three other regions (with the remaining regions between), but the margins of statistical uncertainty mean that we can’t entirely be confident that there are real differences between the English regions at all.
“The picture by age groups in England is more varied. ONS estimate the rates went up in all age groups in the latest week, except for the two youngest groups (from age 2 up to school year 11). There they say the trend is uncertain for age 2 to school year 6, but decreasing for school years 7 to 11. The upshot is that the latest estimates, for the week ending 3 October, show considerably lower infection rates for children of school age and below (1 in 55 for those aged 2 years to school year 6, 1 in 70 for school years 7 to 11, but with quite a lot of statistical uncertainty), than for adult age groups, where the estimated rates are between 1 in 25 and 1 in 40 for the different groups. It’s concerning that the highest estimated rate is for the oldest group, those aged 70 and over, where an estimated 1 in every 25 would test positive. That’s because generally the risks from being infected are highest in the oldest age group, though perhaps the availability of autumn boosters for that group first would reduce the severity. But the much lower infection rates in children of school age and younger is good news, given the very high infection rates in those ages before the summer holidays, and given the concern that children returning to school for the autumn term might lead to more infections generally.
“I do still consider that the CIS is the most reliable source we have, these days, for trends and levels of infection in the UK with the virus that can cause Covid-19, regardless of whether people have symptoms. Its results are based on PCR tests on a representative sample of the UK population (aged 2 or over, living in private households rather than communal establishments like care homes), who are tested only for the purpose of tracking patterns of infection. No survey is perfect, of course, but the CIS doesn’t really have rivals in most respects.
“The numbers of cases on the Government dashboard depend very much on who gets tested (and reports the test results to the health services), and testing is much less common that it used to be. The other representative population survey that used to take place in England, REACT-1, stopped after March this year. Estimates based on data from volunteers who report to the ZOE app are still published regularly, but generally cover only infections that cause symptoms, and many infections don’t cause any symptoms but can still sometimes be passed on to others.
“However, ZOE does continue, and remains a useful source of figures. It has a very, very different methodology than the CIS, and depends on volunteers using the ZOE app and sending in reports on their health regularly. But it certainly has one advantage, which is that there isn’t nearly so much of a lag in the ZOE estimates. Today (14 October), ZOE are publishing estimates for the number of infections across the UK for yesterday, 13 October, for which the estimate is just over 3 million. (ZOE also gives daily estimates of the number of new infections, which is called ‘incidence’ in the jargon, but I’m concentrating on the ‘prevalence’ figures because they correspond to the CIS estimates. CIS also used to publish incidence estimates, and may return to doing so in the future, but they have not published any new incidence estimates since June for various reasons.)
“The ZOE and CIS prevalence estimates have generally tracked each other reasonably closely, though they are certainly not identical, for a number of reasons. The latest data for which one can add up all the CIS estimates for all four UK countries is 29 September, a couple of weeks ago now, and the total CIS estimate of people who would test positive on that data is about 1.7 million. The ZOE estimate for the same date is about 2.2 million. (Some of the difference between these figures is down to differences in the definition of what counts as an infection.)
“But what’s particularly interesting about the latest ZOE prevalence estimates is that they appear to show a slight slowing in the rate of increase of cases in the most recent four or five days. If that continues, it’s encouraging. But, I’d say, it’s too early to get excited. A slowing in the rate of increase is what you’d see if we were getting close to a peak of infections, but it’s also what you might see as a small wobble in the curve part of the way up to a high peak. It’s just too early to tell, in my view – and it’s really important to note that ZOE aren’t saying the rate of infection is falling. It’s still rising, according to the ZOE estimates, and rising moderately fast by comparison with some earlier times, but it’s rising rather more slowly than it was a week ago. The ZOE estimate of infection prevalence went up almost 200,000 between 9 and 13 October – that’s quite a substantial increase in just 4 days. None of this can be checked using CIS data, because of the inevitable lag in producing CIS estimates. It will be important to do a comparison with the CIS figures published over the next two weeks or so.
“One interesting point is that the latest ZOE estimate for the effective reproduction number, the so-called R number, is 1.0 for most parts of the UK. Since R is the average number of people who will be infected by each infected person, you might wonder how numbers of infected people can still be rising when each infected person infects, on average, just one other. Well, it’s not as simple as that.
“Suppose infections have been rising for a time (as they have, according to both ZOE and the CIS, and indeed every other reputable source of data, for England at least). A person newly infected does not instantly infect others. There’s a lag (called the serial interval, in the jargon). That does vary between people, and there’s not total agreement on how long it is anyway, but for the purposes of illustration, let’s say it’s four days, and that it’s the same for everyone. So the people infected today were infected four days ago, and if R were exactly 1, the number of new infections today would be the same as the number of new infections four days ago. But when infections have been increasing, the effective R four days ago was probably more than 1, so in fact the number of new infections today is more than it was four days ago, and the number of new infections four days ago was more than four days before that, and so on. The number of new infections will continue to rise for a time after the R number falls to 1. This is an over-simplification, but it does give the overall idea that R falling to 1 doesn’t instantly stop new infections increasing.
“It’s even more complicated if we look at prevalence data – the number of people who are infected, whether it’s a new infection or they have had it for some time, as in the ZOE prevalence estimates and the CIS estimates. Even after new cases have begun to fall, there will be a longer lag before the total number of infected people starts to fall, because the increasing numbers of new infections in the past have to work through the figures as their infections stop. Things do, unavoidably, take a certain time to turn round once R has fallen to 1 or below.
“And anyway, that was all on the assumption that R has indeed fallen to 1 or below. The latest ZOE estimates are not all below 1 for every region and country in the UK. They are above 1 for Scotland and for Northern Ireland, and for two regions of England. ZOE also publishes ranges of statistical uncertainty for its R number estimates. None of those ranges of uncertainty goes below 1.0 at all – indeed all but one of them goes above 1.0. So these R number estimates aren’t by any means saying that the infections are reducing. If the R estimates continue to fall, then infections will in the end fall (assuming the estimates are accurate), but not quite yet. And it’s far too early to say that the R estimates are going to continue to fall, though I very much hope they do.
“The CIS does not publish estimates of R. The UK Health Security Agency (UKHSA) does publish R estimates fortnightly, for England and for the English regions, and the latest set came out today. (See https://www.gov.uk/guidance/the-r-value-and-growth-rate.) Because estimating R is a statistical process and can’t be exact, they (sensibly) give ranges rather than a single number. The latest one for England goes from 1.1 to 1.3, higher than the latest range from ZOE for England (1.0 to 1.1), but that’s not surprising since (as UKHSA clearly say) there’s a lag in the R estimation process, so that it really represents conditions 2 to 3 weeks ago. These UKHSA estimates are published alongside estimates of the growth rate, which in my view are much easier to interpret than the R numbers, because they relate much more directly to numbers of new infections. The latest published range from UKHSA for the growth rate for England is 3% to 6% per day, meaning that the number of new infections on one day will be somewhere between 3% and 6% higher than the number the day before – so still a pattern of increasing infection. But again those growth rate estimates really relate to the position 2 or 3 weeks earlier, not the position today.
“All these lags are very frustrating, I admit, but they are inevitable to some extent in tracking an infectious disease. We just don’t know how things are exactly today or yesterday, or really for at least a few days before that, however much we’d like to know. And what I’d really like to know is how things are going to move over the next few weeks, but it’s simply impossible to know that future.”
Prof Sheila Bird, Honorary Professor, University of Edinburgh’s College of Medicine and Veterinary Medicine; and Visiting Senior Fellow at the MRC Biostatistics Unit, University of Cambridge, said:
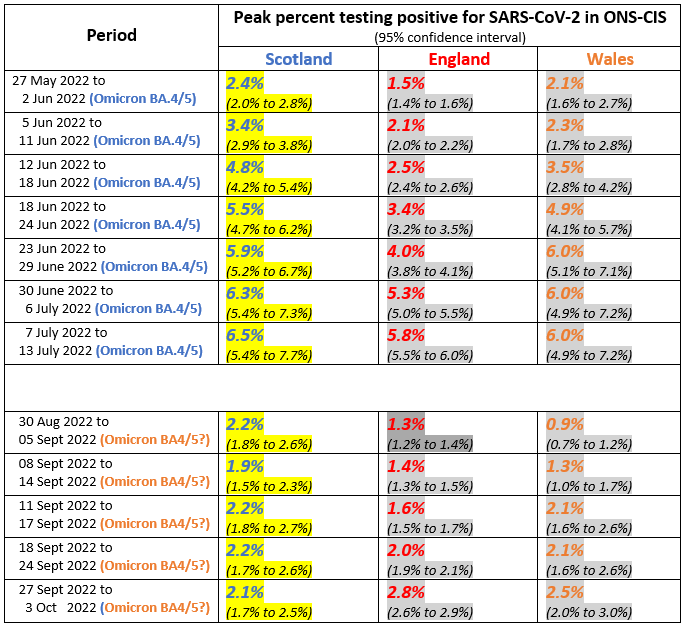
“Table 1 (bottom panel) shows that England’s percent testing positive in ONS Community Infection Survey has taken three weeks to double from 1.4% (95% CI: 1.3% to 1.5%) during 8-14 September to 2.8% (95% CI: 2.6% to 2.9%) during 27 September to 3 October. Meanwhile, Scotland’s percent testing positive has remained around 2.1% (current 95% CI: 1.7% to 2.5%). Both are substantially lower than each nation’s July peak of Omicron BA.4/5 at around 6%.
“Whether another variant challenge is underway in the UK remains to be seen.”
Table 1: Variant-specific peaks pre-Omicron BA.2 in percent testing positive for SARS-CoV-2, as reported by ONS Community Infection Survey & throughout later Omicron variants.
All our previous output on this subject can be seen at this weblink:
www.sciencemediacentre.org/tag/covid-19
Declared interests
Prof Kevin McConway: “I am a Trustee of the SMC and a member of its Advisory Committee. My quote above is in my capacity as an independent professional statistician.”
For all other experts, no reply to our request for DOIs was received.