

select search filters
briefings
roundups & rapid reactions
Fiona fox's blog
The Office for National Statistics (ONS) have released the latest data from their COVID-19 Infection Survey in England, Wales and Northern Ireland.
Prof Sheila Bird, former Programme Leader, MRC Biostatistics Unit, University of Cambridge, said:
“Although the ONS Infection Survey now covers both Wales and Northern Ireland, neither has yet contributed sufficient person-weeks for their data to be informative. For example, during the six weeks from 9 August to 19 September, the ONS Infection Survey in Wales accounted for nine positive participants out of 3,708 participants who underwent 9, 268 tests (12 of which were positive).
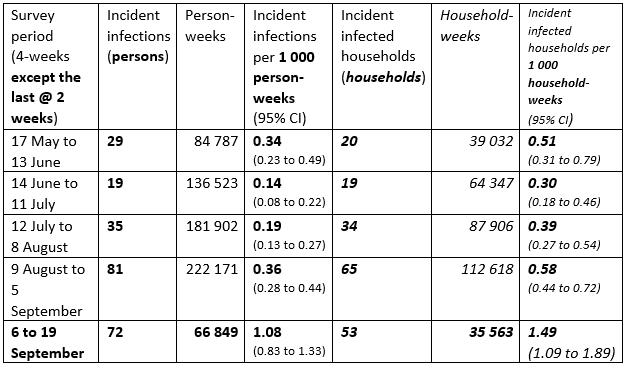
“My table summarizes the ONS Infection Survey in England in four 4-week periods together with the most recent fortnight. Incident infections per 1 000 participant-weeks halved during 14 June to 8 August from 0.34 per 1 000 person-weeks during 17 May to 13 June but have since been regained 0.36 per 1 000 person-weeks and climbed dramatically in the most recent fortnight to 1.08 per 1 000 person-weeks (95% confidence interval: 0.83 to 1.33).
“The ONS Infection Survey has roughly half as many households as it has participants so that the pattern for incident infected households is less definitive in statistical terms but is qualitatively similar and there is no mistaking the most recent fortnight’s sharp increase in newly-infected households: 1.5 newly infected per 1 000 household weeks (95% CI: 1.1 to 1.9).
“Were the ONS Infection Survey’s field-force and analytical-team to embrace, as additional strata, the high-risk quarantined members of a notable weekly random sample of Test & Trace’s households [stratum a) symptomatic index case-households; stratum b) external close contacts], then they’d be likely to accumulate 10 times as many (or more) incident infections per 1 000 T&T-person-weeks as the numbers shown in my table for the most recent fortnight.
“If so, then confidence intervals could narrow by a factor of three which allows for sharper inferences.”
Prof Kevin McConway, Emeritus Professor of Applied Statistics at The Open University, said:
“The new data from the NHS Infection Survey, for the week ending 19 September, confirm the impression from the Government’s daily new case counts and from the NHS Test and Trace results, that the number of infections in the English community population is continuing to increase, and indeed to increase at a rate that gives me cause for concern. The survey also covers Wales, where ONS are now reporting (for the first time) that there is suggestion of increasing numbers of infections, though the evidence is not so clear as in England because fewer people can be tested in Wales. This week data from the survey in Northern Ireland are published for the first time. It’s too early to say anything about trends in the Northern Ireland data, and there is even more statistical uncertainty than in Wales because of limited numbers of participants so far.
“The big advantage of the ONS survey for tracking numbers of infections, compared to Test and Trace results and the daily new case counts, is that the survey is based on a large and representative sample of the whole community population of the countries involved. The other data sources depend on people being tested for a reason – very often because they have symptoms, or sometimes because they are involved in a possible outbreak, or because they work in care homes or some other kind of job that requires close surveillance of their infection status. So the numbers and rates of positive cases from Test and Trace and the daily new case counts can be affected by changes in the number of tests carried out, in the type of people that are being tested, in the areas where testing is being done, or in the availability of tests. None of that applies to the ONS survey. In that survey, people are tested regardless of their symptoms or job or where they work, but only to measure the level of infection across the country.
“It’s still worth looking at whether the most recent numbers from the ONS survey are in accord with other data, particularly the NHS Test and Trace data that were updated yesterday*. Looking at a change over just one week, particularly for Test and Trace, can be misleading because of statistical variations, particularly on Test and Trace where the availability of tests can make a difference. Yesterday’s Test and Trace bulletin said that the positive cases for the week ending 16 September were ‘almost 3 times’ the number from three weeks earlier (actually 2.8 times). Comparing the latest week’s estimate of infections from the ONS survey (for week ending 19 September) with the ONS estimate from three weeks earlier, the latest week’s estimate is 3.8 times as big as the earlier week. For new infections, as opposed to the count of positive tests which includes people whose infection is carrying on from one week to the next, the ratio is larger. The ONS estimate of new infections for the week ending 19 September is about 4.8 times the number for three weeks earlier. So the ONS data, which are less subject to various biases than the Test and Trace data, are showing a faster rate of increase than the most recent Test and Trace results did. The ONS results don’t correspond to a doubling of new cases each week, but they are consistent with a doubling time of around a week and a half, which isn’t really much different. We mustn’t forget that the ONS estimates have quite a wide margin of statistical error, because they are based on a survey. The survey tests many people – about 80,000 in England in the most recent two weeks – but the great majority are not infected. Only 163 tested positive in the most recent two weeks, and only 72 of those were new infections. So, though the central ONS estimate is that there were 9,600 new infections each day in England in the most recent week, the data are also consistent with smaller and larger numbers than that (between 7,100 and 12,600 new infections per day). So the true doubling time may well not be a week and a half – it could be more than that, or less. But these results are concerning anyway.”
Dr Simon Clarke, Associate Professor of Cellular Microbiology at the University of Reading, said:
“These data indicate that the ONS believes the number of daily coronavirus infections has tripled in a fortnight. It’s a worrying increase and is occurring across all age groups, particularly in the North of England and London. While cases are not escalating at the rate they did in March, it’s simply not credible to write them off as anything other than significant. While it’s true that there are many more tests conducted nowadays, this is clear evidence of an accelerating spread of the virus. As the world approaches the grim milestone of a million deaths from Covid19, we can expect to see an increasing burden placed on our hospitals and a consequent increase in deaths.”
All our previous output on this subject can be seen at this weblink:
www.sciencemediacentre.org/tag/covid-19
Declared interests
Prof Sheila Bird: SMB is a member of the Royal Statistical Society’s COVUD-19 Taskforce which made recommendations on how to glean intelligence from Test & Trace by random visits to count asymptomatic versus symptomatic infections and audit “stay at home” adherence.
Prof Kevin McConway: “I am a member of the SMC Advisory Committee, but my quote above is in my capacity as a professional statistician.”
None others received.