

select search filters
briefings
roundups & rapid reactions
Fiona fox's blog
The Office for National Statistics (ONS) have released provisional counts of the number of deaths registered in England and Wales in the week ending 10 September 2021.
Prof Sheila Bird, Formerly Programme Leader, MRC Biostatistics Unit, University of Cambridge, said:
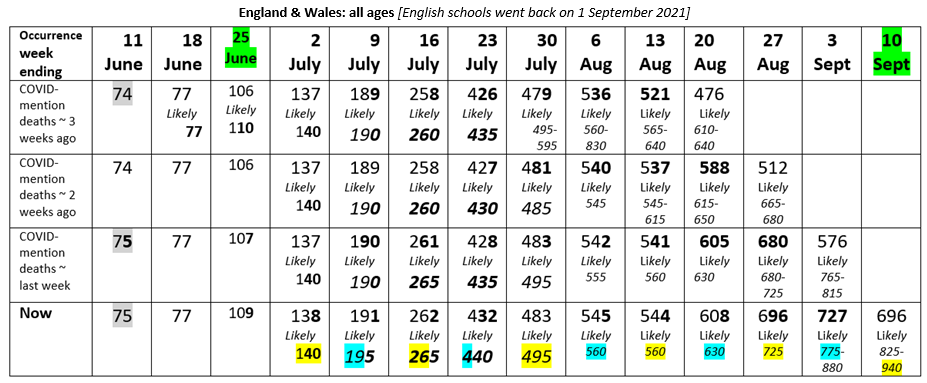
“Tracking COVID-mention deaths by week of occurrence matters. Registration delays are longer in England & Wales than in Scotland. Also, as shown in my tables below, epidemiological week is defined differently north and south of the border.
“Tables on COVID-mention deaths by week of occurrence should perhaps heed ONS Infection Survey’s prevalence estimates some 4+ weeks earlier. Hence in England 0.61% (95% CI: 0.54% to 0.68%) of the population had COVID during 27 June to 3 July 2021 versus: 1.06% (95% CI: 0.98% to 1.15%) during 4 to 10 July; 1.33% (1.25% to 1.43%) during 31 July to 6 August and 1.41% (1.31% to 1.51%), not significantly different, during the report-week of 21 to 27 August 2021. However, for England’s school-year 7 to 11, ONS Infection Survey’s modelled prevalence at 8 September was 2.74% (95% CI: 2.3% to 3.3%).
“For Scotland, the corresponding percentages (with wide 95% confidence intervals) were 1.01% (0.8% to 1.3%) versus: 1.14% (0.9% to 1.4%), 0.53% (0.4% to 0.7%), and 1.32% (1.1% to 1.6%) markedly increased again. Inter alia, Scottish schools returned in mid-August.
“In England & Wales, wave 1 accounted for 52,000 COVID-mention deaths (to nearest 1000), the peak weekly toll having been 8,350 deaths (nearest 10). Wave 2 in England & Wales accounted for 69% more COVID-mention deaths (88,000 to nearest 1000) with a weekly peak of 9,030 deaths (nearest 10).
“Wave 3 for England & Wales is shown below from mid-June 2021: the occurrence of COVID-mention deaths had not peaked by the week ending 13 August 2021. Moreover, return to English schools on 1 September 2021 is associated with a further upswing.
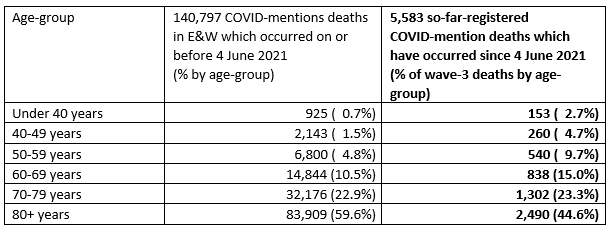
“The age-distribution for occurrences of COVID-mention deaths in wave 3 (thus far registered) versus those prior to week ending 11 June 2021 is shown below.
“Due largely to vaccination and variant, the age distribution is strikingly younger for the 5,583 COVID-mention deaths in England and Wales thus far in wave 3 versus COVID-mention deaths which occurred earlier in the pandemic, that is: up to 4 June 2021. In the current wave, 17% of COVID-death occurrences are persons under 60 years of age (95% CI: 16% to 18%) versus only 7% hitherto.”
Comment on both the weekly deaths stats and the Monthly Mortality Analysis, England and Wales, August 2021
Prof Kevin McConway, Emeritus Professor of Applied Statistics, The Open University, said:
“The weekly ONS bulletin giving provisional data on death registrations in England and Wales, with some figures for the whole UK, takes the data forward to the week 4-10 September. In England, Wales and Northern Ireland, that’s the week after the one that contained the August bank holiday. The bank holiday disrupts death registrations to some extent, because register offices are closed. Because of that, the numbers of registered deaths in last week’s bulletin were lower than they would have been without the holiday. Those deaths that weren’t registered that week would still have to be registered some time, so the numbers for the latest week in this week’s bulletin will be a bit higher than they would have been without the holiday the week before. However, looking at short-term comparisons over just one week, when both weeks have numbers affected by the bank holiday, isn’t going to make good sense, so I won’t say much about that.
“Considering death registrations where Covid-19 is mentioned on the death certificate, the news isn’t wonderful. The total number of these Covid-related death registrations in the whole UK in the week 4-10 September was 994, which is considerably up on the week before (781), and indeed a lot higher than two weeks before, the week ending 27 August, when the figure was 769, which would not have been affected by the bank holiday. The increase is particularly marked in Wales, where the number went up from 25 to 65. In Northern Ireland, there was a slight fall, but the Covid registrations increased in England and in Scotland. Some of those increases (except in Scotland) would have been due to more deaths than usual being registered late after the bank holiday week. But the average number of registrations involving Covid-19 in the bank holiday week and the following week should, very roughly, balance out the low registrations in the holiday week and the high registrations the following week. The UK average for those two weeks is 888 deaths involving Covid-19, and that would be the highest UK-wide weekly figure since mid-March this year. That does, broadly, match what’s been seen in terms of numbers of deaths within 28 days of a positive Covid test, on the dashboard at coronavirus.data.gov.uk. Numbers of Covid-related deaths are far below the levels from January and February this year, or Spring 2020, thanks to vaccination, but they are still high enough to cause me some concern. The dashboard figures on deaths for the whole UK have been showing some signs of plateauing or even reducing in the past week or so, with the peak being around the time of the latest week in the ONS registration figures (4-10 September). But whether next week’s ONS figures show a similar trend, and, if they do, how long it might continue, remain to be seen.
“The latest ONS figure for registrations of deaths from all causes in England and Wales, again for 4-10 September, will also be affected by the bank holiday the week before. The latest week’s figure, 11,035 deaths registered, is considerably higher than the week before, though to a considerable extent that will be due to late registrations after the bank holiday, so the increase isn’t really a cause for concern. The average of the all-cause death registrations for the bank holiday week and the week after, which might roughly give the figure we’d have seen without the bank holiday disruption, is 9,916, which is lower than the figure for the week before the bank holiday (ending 27 August) and indeed lower than the figures for every week since 23 July. All-cause deaths, however, are still running above the average numbers for the five years 2015-19, as they have been since the start of July. So there are excess deaths, they are still happening at quite a high level, and the number of excess deaths is not all explained by deaths involving Covid-19 by any means.
“It’s still not clear, to me at least, what is causing these excess deaths. I had hoped that some light might be thrown by another ONS release published today, which gives their regular monthly analysis of mortality in England and Wales for the month of August, when the excess deaths were already occurring in substantial weekly numbers. These monthly bulletins give rather more information on the cause of death than the weekly provisional bulletins, which give numbers by cause only for deaths involving either Covid-19, or influenza and pneumonia. The latest monthly bulletin does confirm that there were excess deaths in England and Wales in August, compared to the five-year average. In total, across both England and Wales, there were 43,074 deaths from all causes last month, and the five-year average for 2015-19 was 39,305. So there were 3,769 more deaths registered than the five-year average in August 2021. The number of registered deaths for which Covid-19 was the underlying cause was 2,232 – so over 1,500 of the excess deaths were caused by something else. But the monthly bulletin still doesn’t throw much light on what did cause them, particularly in England. The bulletin does not give data on all possible causes of death separately, but only on the top ten. In England, the death rates for eight of the top ten causes are actually lower than they were, on average, in 2015-19, though for three of them, the difference between the August 2021 level and the five-year average is small and within the bounds of statistical uncertainty. The exceptions, where deaths were higher than average, are Covid-19, of course, since no deaths from that cause were registered in 2015-19, and the rather vague set of causes called “Symptoms, signs and ill-defined conditions”. Covid-19 came third in the horrible league table of leading causes of death in England last month, accounting for about one in every 19 deaths. In July 2021 in England, Covid-19 came 9th in the top ten leading causes, emphasising that Covid-19 deaths have become much more prominent since then.
“In Wales, the pattern of causes of death isn’t so clear as in England, largely because there are many fewer deaths because of the smaller population, so statistical variability is larger and it’s harder to pick out clear trends. In August, Covid-19 came seventh in the list of the top ten causes of death in Wales, accounting for about one in every 37 deaths. In July in Wales, Covid-19 wasn’t even anywhere near being in the top ten causes – it came 22nd. But in Wales in August, it wasn’t just Covid-19 that was showing more deaths than the average for 2015-19. That was also true of four other causes of death in the top ten causes – the most frequent cause of death, ischaemic heart disease (heart attacks and similar conditions), and also chronic lower respiratory diseases (COPD etc.), liver disease including cirrhosis, and (as for England) “Symptoms, signs and ill-defined conditions”. However, because of the greater statistical uncertainty compared to England, none of those increases above the five-year average is bigger than the bounds of statistical uncertainty. Really the only causes of death in the top ten where the position in Wales in August is definitely different from the five year average are influenza and pneumonia, where the August figure is a long way below average, and possibly cerebrovascular diseases (strokes etc.). It’s not surprising that deaths from influenza and pneumonia were well below the five-year average – they were in England too. There’s really been very little flu about this year.
“So altogether, across England and Wales, I’d say there’s still no clear indication of the cause of the non-Covid excess deaths in August. Maybe it will become clear when we get more detailed figures on causes of death but that won’t be until the annual data are published, next year some time.”
Prof Paul Hunter, Professor in Medicine, The Norwich School of Medicine, University of East Anglia, said:
“This week’s reports of recorded deaths reports for England and Wales is the tenth consecutive week when the total number of deaths reported have been greater than the average number of deaths reported in the same week over the 5 years 2015 to 2019. In all but one of those weeks the number of “excess deaths” have exceed reported COVID deaths. The one week where this was not the case was the week ending 3rd September which was a week that included a bank holiday and so subject to reporting delays.
“From 2nd July to 10th September there was 9619 excess deaths reported and only 4984 COVID deaths. Given the large number of COVID deaths over the past 18 months one would have expected excess deaths to be lower than COVID deaths and although this was the case in March to June 2021 this is certainly not the case now.
“Why we are seeing so many excess deaths at present that cannot be explained by COVID deaths is a real concern. It is not clear to me why we are seeing so many non-COVID excess deaths. Influenza reports are still very low in the routine surveillance (https://assets.publishing.service.gov.uk/government/uploads/system/uploads/attachment_data/file/1018187/Weekly_Flu_and_COVID-19_report_w37.pdf – see figure 14.) However, looking at causes of deaths it does look like respiratory deaths are particularly high this year compared to the average for the years 2015 to 2019.
“Possible explanations include delays in care for other diseases as a result of the pandemic, though given the high levels of non-COVID respiratory deaths this is probably not the answer. Another, and I suspect more likely explanation, could be that normal non COVID, non influenza infections are causing more severe disease now that these infections are spreading again after a long period where they were not common and which our immunity was not being boosted by repeat exposure. There is certainly quite a bit of both RSV and Rhinovirus infections around. However, it is not possible to be certain with the available data, though this is an issue that needs to be monitored.”
Weekly deaths stats week ending 10 September 2021
Monthly Mortality Analysis, England and Wales, August 2021
https://www.ons.gov.uk/releases/monthlymortalityanalysisenglandandwalesaugust2021
All our previous output on this subject can be seen at this weblink:
www.sciencemediacentre.org/tag/covid-19
Declared interests
Prof Kevin McConway: “I am a Trustee of the SMC and a member of its Advisory Committee. I am also a member of the Public Data Advisory Group, which provides expert advice to the Cabinet Office on aspects of public understanding of data during the pandemic. My quote above is in my capacity as an independent professional statistician.”
None others received.