

select search filters
briefings
roundups & rapid reactions
Fiona fox's blog
The Office for National Statistics (ONS) have released the latest data from their COVID-19 Infection Survey.
Prof Sheila Bird, Formerly Programme Leader, MRC Biostatistics Unit, University of Cambridge, said:
“For England by age-group, the table below compares the prevalence of infection and prevalence of antibodies as recently reported by ONS Infection Survey.
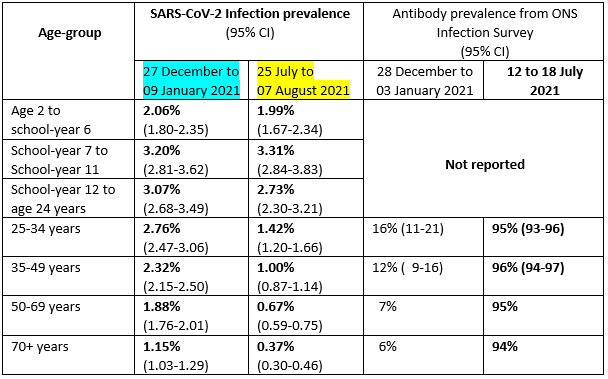
“Note that, for persons aged 25+ years in 2020 and essentially pre-vaccination, it took 5 fortnights (for younger adults) to 7 fortnights (at 70+ years) to go from the currently-reported age-specific prevalence of SARS-CoV-2 infection to that were observed for the Alpha variant at the end of December 2020. Of course, the Delta variant (not Alpha) now predominates.
“For unvaccinated children, observe that the current and end-December 2020 infection prevalences are broadly similar whereas, for the increasingly vaccinated older cadres, the two prevalences diverge dramatically; and increasingly so with age. In part, the latter phenomenon may be because diffusion of infection to the oldest age-groups generally takes longer (compare 5 fortnights versus 7 fortnights in late 2020).
“Re-infection by the Delta variant is clearly a real concern because the end-December 2020 Alpha prevelances were aided and abetted by then-low antibody prevelances (see right-side of table). However, the current prevalence of SARS-CoV-2 infection by the more transmissible Delta variant has occurred despite high adult prevalences of neutralizing antibodies.
“Of course, cellular immunity, which is what really counts, is not measured in the ONS Infection Survey.”
Dr Simon Clarke, Associate Professor in Cellular Microbiology at the University of Reading, said:
“Compared to the same week1 in 2020, where ONS estimated 28,300 or 1 in 1,900 people in England were infected with Covid-19, the data sets for the week ending 6 August this year estimate that 726,700 or 1 in 75 are infected.
“That is around 25 times higher than it was a year ago, when the population was unvaccinated and the country was 10 weeks into its re-opening.
“The vaccine rollout is however reducing the number of hospital admissions and deaths. This time last year in England, there were about 2,000 hospitalised Covid-19 patients and 15 deaths per day, while these latest figures show a more modest increase in the number of hospital patients at 5,000 and deaths at about 76 per day.
“We are seeing an early sense of what living with Covid-19 looks like. As restrictions are lifted and the economy rebounds, we are ‘running hot’ when it comes to managing Covid spread. Wider rollout of the vaccine may reduce infections, but high case numbers still place an unnecessary burden on the NHS.
“A Covid-19 infected patient admitted with an unrelated health problem will pose a risk to other patients, and even more so where they are asymptomatic. We have seen evidence of the way Covid numbers spread rapidly in hospitals last year, despite the best efforts of healthcare professionals. Ensuring vulnerable people in hospital are protected from high levels of Covid in the community presents very real problems and extra demand on NHS time and resources.”
Prof Kevin McConway, Emeritus Professor of Applied Statistics, The Open University, said:
“This week’s bulletin on the ONS Covid-19 Infection Survey (CIS) takes the estimates of prevalence of infection up to last week, the week ending 6 August. Overall, I’d say, the news isn’t wonderful, but nor is it particularly bad, and it’s not unexpected. Also, the position does vary across the UK. Overall, the position is pretty static. In England, for the second week running, ONS estimate that about 1 person in every 75 in the community population would test positive for the virus that can cause Covid-19. ONS point out that across the most recent two weeks, the trend in England is downwards, but it’s flattening off – and as ONS are careful to point out, the infection rate is still high, around the level of late January this year or mid-December last year, when we were all rightly concerned about the level of infection. Of course, vaccination has reduced quite drastically the chance of severe infection, if someone become infected, but we mustn’t forget that the infection level is high and that that can have consequences in illness and death.
“In Wales, ONS say that the trend in numbers who would test positive is uncertain, and the level is again much lower than in England with an estimated 1 in 220 testing positive (but with quite a lot of statistical uncertainty because Wales is a much smaller country than England). Last week’s CIS bulletin showed a rapidly increasing trend in infection in Northern Ireland. The relatively good news there for the most recent week is that the trend there looks uncertain, but appears at least not to be going up so fast. ONS estimate that 1 in 55 would test positive in Northern Ireland, the same estimate as the week before, but there is again a lot of statistical uncertainty involved because Northern Ireland has a small population. Again, though, ONS point out that the infection rate in Northern Ireland is high – the estimated rate is currently the highest of all four UK countries, and (with last week) it is the highest the rate has been since the CIS began in Northern Ireland last autumn. This week’s CIS news for Scotland is again the most encouraging of all the UK countries. The trend is again downwards, and for the most recent week, ONS estimate that 1 in 190 people in Scotland would test positive. This is the third week running that the infection rate has fallen in Scotland, and the estimate is now not much higher than for Wales. In fact, taking into account the statistical margins of error, it’s not even certain that the rate in Scotland is higher than the rate in Wales at all.
“It’s tempting to conclude that this general flattening off of the decreasing trend in infections that we saw in last week’s CIS bulletin is something to do with the removal of restrictions in England on 19 July, and similar de-restrictions in other UK countries. Indeed, that’s a possible explanation. Enough time has passed between 19 July and the latest week of estimates (week ending 6 August) for people to change their behaviour, mix more, become infected, and show up in the CIS sample, and that would work in the opposite direction to factors like the start of the school holidays across most of the UK, which would tend to reduce mixing and hence reduce infections. But just because that’s a possible explanation, that doesn’t mean it’s correct. There’s nothing in these ONS results that say how the infected people came to get infected, so these particular results can’t, on their own, firmly establish any effects of the 19 July changes. What they do firmly establish, though, is that we can’t be complacent and assume all the risk is over.
“None of these trends is particularly surprising, because they do broadly match the trends in the daily numbers of new confirmed cases on the dashboard at coronavirus.data.gov.uk. There’s always the possibility that the trends won’t match up. There are many potential biases in the daily confirmed case counts, because they depend on how many people turn up to be tested and why. The CIS results are based on a representative sample of the community population, tested only to monitor the track of the pandemic, regardless of whether they have symptoms, what their job is, and so on. Those confirmed case counts do show a flattening off of the decrease in new cases that has been going on (at differing rates) in England and Wales since roughly mid-July, and indeed there’s some evidence of an increase recently. In Northern Ireland the pattern of confirmed cases has been more irregular, partly because the population is smaller than in the other UK countries so that there’s more statistical variability. In Scotland, the decline in new confirmed cases began earlier, around the beginning of July, though again very recently there are signs of flattening off or increase. The CIS prevalence data generally match these trends. They have not (yet) picked up the possible increases in confirmed cases in the most recent week or so – that is probably simply because these CIS estimates are for everyone who would test positive, even if their infection started some days or even more than a week ago, unlike the confirmed case counts which are for new cases only.
“The CIS does also provide so-called incidence rate estimates, which estimate the number of new infections daily. However, for technical reasons these cannot be as up to date as the prevalence estimates that I’ve discussed so far – the latest week in the incidence estimates is 18-24 July. Until this week’s CIS bulletin, those incidence estimates were rising in England, Wales, and Northern Ireland, but had been falling in Scotland from the start of July. In this week’s bulletin, the incidence rate estimates for the week ending 24 July are down in England and in Wales, compared to the week ending 17 July, and this matches the pattern of confirmed cases on the dashboard, which started falling at about the same time. For Northern Ireland, the estimate of the rate of new cases for the week ending 24 July is considerably up on the week before – ONS estimate that 3,100 new infections were happening in Northern Ireland each day in that week. That’s a lot for a country with a population of under 2 million. Broadly all these trends do match the patterns of new confirmed cases on the dashboard.
“Back on the prevalence rate estimates (all infections, not just new ones), ONS report data on the individual regions of England, and on age groups. These estimates are subject to much more statistical uncertainty than are the estimates for the whole of England, because the population size and number of people tested in the CIS are obviously a lot smaller in an individual regions or age group than for the whole country. Since the overall position in England is that infection levels were pretty static, it’s perhaps not surprising that the rates in some regions are up a bit for the latest week compared to the week before, and some are down a bit. ONS warn against over-interpreting small movements in the estimates, so I won’t be tempted to do that. Infection rates do remain rather higher in the North and the Midlands, and arguably in London, than in the South. In terms of age groups, ONS report that the rate in those aged between school year 12 (16 or 17 years) and 24 years increased compared to the previous week, but trends in other age groups are uncertain. Rates remain highest in those of secondary school age and up to 24 years old.”
Prof James Naismith, Director of the Rosalind Franklin Institute, and University of Oxford, said:
“A useful definition of science is first look at the data before opening one’s mouth. No prediction, no theory, no argument no matter how clever or how popular has any value if disproved by data.
“We cannot pontificate our way past the grim reality of this virus.
“This week’s ONS survey data up to 7th August undermine some of overly certain rhetoric about the trajectory of covid19 infections. The data show that prevalence in Scotland has fallen to around 5 to 6 per thousand, whilst England is largely unchanged from last week, at around 15 per thousand.
“The third wave which took off mid June has peaked in England around the end of July, somewhat earlier in Scotland.
“All other things being equal, we would expect the same steady decline in case numbers in Scotland to be mirrored in England. However, other things are not equal. Of particular note are two events; firstly the end of restrictions in Scotland and England and secondly the return to school in Scotland soon to be followed by England. This will be followed by a move indoors as the summer wanes.
“I would expect to see a rise in cases, a “fourth” wave. I do not know the size of any new increase nor do I put much faith in those that claim with certainty to “know”. I do think models are extremely useful and of more value than what are in fact “off the cuff guesses” presented as facts. Responsible modellers do always state caveats and there is particular uncertainty about the trajectory at the moment given the very new circumstance we find ourselves in.
“I know that any significant rise in cases will lead to more long covid19 and increase the pressure on the NHS.
“I also know that safe and effective vaccines have already saved tens of thousands of lives, I would like to see a more effective campaign to encourage the take up amongst the hesitant.
“The more vaccinated people, the smaller any fourth wave.
“Pop up clinics at night clubs, football grounds, religious venues and underserved communities have all been shown to be effective.
“Without a change, the UK vaccine coverage is likely to drop behind even more comparator countries; a very disappointing outcome given our promising start. We should look abroad and learn.
“It is now clear that with Delta, vaccines will not entirely prevent virus circulation but massively reduce deaths and serious illness. Therefore there should be a renewed push for new therapeutics and mitigation measures such as enhanced ventilation.
“We all need to understand the symptoms that should lead us to stay at home.”
All our previous output on this subject can be seen at this weblink:
www.sciencemediacentre.org/tag/covid-19
Declared interests
Prof Kevin McConway: “I am a Trustee of the SMC and a member of its Advisory Committee. I am also a member of the Public Data Advisory Group, which provides expert advice to the Cabinet Office on aspects of public understanding of data during the pandemic. My quote above is in my capacity as an independent professional statistician.”
None others received.