

select search filters
briefings
roundups & rapid reactions
Fiona fox's blog
The Office for National Statistics (ONS) have released the latest data from their COVID-19 Infection Survey.
Dr Simon Clarke, Associate Professor in Cellular Microbiology, University of Reading, said:
“The latest ONS Infection Survey is somewhat alarming, given that Scotland now has its highest ever level of Covid-19 infection, with 1 in 45 people carrying the virus. That represents a quadrupling of infections in four weeks.
“In that time, Covid hospitalisations in Scotland have tripled and the number of those requiring the assistance of a ventilator have doubled. Given as there is a lag between infections and hospitalisations, we can expect further increases over the coming weeks.
“Claims that immunity is holding up in the UK should be viewed in light of increasing numbers of infections and hospitalisations. It is curious that the two most advanced nations to roll out vaccination, the other being Israel, are two countries with some of the highest infection numbers. Like Israel, the UK governments may now have to consider imposing restrictions on our lives in order to head-off another lockdown. The pandemic should have taught our politicians of the importance of closing the stable door before the horse bolts.”
Prof James Naismith, Director of the Rosalind Franklin Institute, and University of Oxford, said:
“Today’s ONS figures cover the week ending 3rd September. The headline messages are that in Scotland roughly 22 (range 18 to 25) people in every 1000 are infected and in England the number is around 14 (range 13 to 15) in 1000. Scotland saw a further lurch upwards in prevalence, while prevalence in England remained flat (but high).
“Scotland’s lurch was evident in the data to 25th August. Although the seven day average of daily cases indicate Scotland’s new newest wave has plateaued, I suggest we wait for next week’s ONS figures before making this conclusion.
“It was expected that Scotland’s school return (19th August) would lead to rise. Since English schools, did not go back until 1st September, the ONS data released today will not report on the effect of English school’s return. I would expect next week’s ONS data to show the beginning of a rise due to schools, this is because I expect England to follow Scotland.
“Too much political discussion focusses on the differences between the UK’s nations, with even scientists claiming one approach is much superior than another. The effect of these “differences” are rather small, looking at the data within England shows similar sized variations. The UK, either whole as individual nations has had a depressingly terrible pandemic. The cumulative death rate (our world in data) is much higher than many comparable countries, not being the absolute worst is hardly worth bragging about.
“The only two interventions that make a big difference are lockdown and vaccination. Vaccination is simple, safe and cheap. Lockdown is painful, expensive and damages health. Vaccination has saved 10,000’s of lives in the UK, therefore the more people we vaccinate the less deaths and long covid19 we will see. Spain, Denmark, France and others, despite a slow start, are now doing better than the UK in their roll out of vaccine. We should learn from them how to accelerate our program.”
Prof Rowland Kao, the Sir Timothy O’Shea Professor of Veterinary Epidemiology and Data Science, University of Edinburgh, said:
“In regards to why Scotland is seeing a higher prevalence of COVID-19 than England, a key point is that Scottish return to schools occurred in mid-August, with some variation. The rise in cases appears to result from increased activity around the school return period but about a week before the actual return date for most students, and therefore is unlikely to be associated strictly with transmission in schools. More likely is a combination of increased activity, for example due to return to workplaces from holidays, increased socialising locally, and possible activities starting around schools.
“Thus in many ways, Scotland’s experience can be viewed as a sneak peek into possible rises in cases that may occur in England over the next few weeks. That the ONS survey in particular shows a difference is important because it shows us that the difference in infection numbers is not just due to an increase in testing that likely occurred at point of schools return. It is worth noting as well, that, while case positivity have gone down noticeably in the last week or so, the survey results have not – this may be due to the rate at which cases are being reported, going down. The higher survey prevalence results are also consistent with the continued high SARS-CoV2 signal in wastewater that is currently found in Scotland.”
Prof Sheila Bird, Formerly Programme Leader, MRC Biostatistics Unit, University of Cambridge, said:
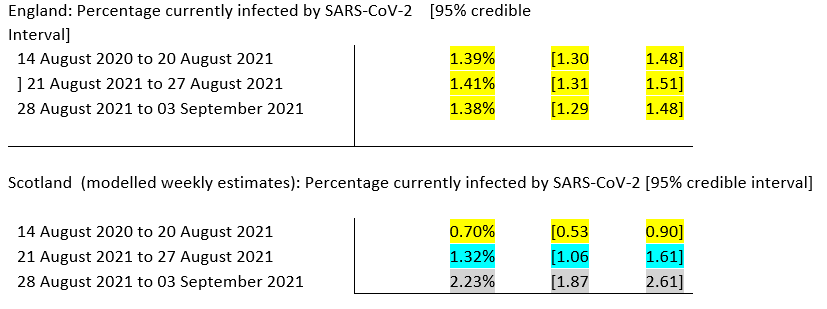
“For the three weeks including the week ending 3 September 2021, the ONS estimate that 1.4% of the community population in England had COVID-19 (95% credible interval: 1.3% to 1.5%) In Scotland, the % of people testing positive increased progressively during these three weeks from 0.7% (95% credible interval: 0.5% to 0.9%) to reach 2.2% (95% credible interval: 1.9% to 2.6%) in the week ending 3 September 2021. One possible reason for this divergence in recent weeks is Scotland’s earlier return to school – about 2 weeks ahead of England, but there are many factors which contribute to the prevalence of infection and so this is somewhat speculative, albeit anticipated.”
Prof Kevin McConway, Emeritus Professor of Applied Statistics, The Open University, said:
“This week’s bulletin on the ONS Covid-19 Infection Survey (CIS) takes the data on prevalence of infection up to the week 28 August to 3 September. It’s not very encouraging. As often in recent weeks, the trends differ between the different UK countries, and indeed between the different regions of England. That pattern of variability across the country is likely to continue, in my view. ONS consider that the percentage of people who would test positive for the virus that can cause Covid-19 is roughly level in England for the latest week, and ‘uncertain’ in Northern Ireland (where the trends are often not so clear, because of the relatively small number of people swabbed for the survey). But in Wales and in Scotland, the percentage testing positive is pretty clearly increasing. As a result of these trends, the estimated proportions of people who would test positive are roughly similar in three of the UK countries, at between 1 in 60 and 1 in 70 testing positive (1 in 60 in Northern Ireland, 1 in 65 in Wales, 1 in 70 in England, though with fairly wide margins of error in Northern Ireland and Wales). But in Scotland, ONS estimate that, in the most recent week, 1 in 45 people would test positive (margin of error from 1 in 40 to 1 in 55). That’s an estimated 117,300 people testing positive in Scotland, which is more than the population of every town and city in Scotland apart from the four largest (Glasgow, Edinburgh, Aberdeen, Dundee).
“Last week the position was that the percentages of people infected were roughly equal in England, Northern Ireland and Scotland, but smaller in Wales. But the increases in Wales and in Scotland this week have moved Wales up to roughly the level of England and Northern Ireland where infection rates haven’t changed much, while the estimated rate in Scotland is now higher than in the other countries. The usual statistical uncertainty associated with survey results, particularly for smaller countries where the number of people sampled for the survey is smaller, means that we can’t be entirely confident that the positivity rate in Scotland is higher than in Wales or Northern Ireland (though it probably is higher). But it’s almost certainly higher in Scotland than in England. And this is the second week running that there’s been a very substantial increase in infection in Scotland, the ONS estimate went up by over two-thirds for the latest week compared to the week before that, and by an even greater amount the week before compared to the previous week, so that the ONS estimated positivity rate in Scotland for the latest week is about four and a half times what it was just three weeks earlier.
“These national patterns do broadly match the trends in new confirmed cases on the dashboard at coronavirus.data.gov.uk. There is a slightly encouraging sign on the dashboard data, where it looks as if new cases in Scotland, classified by when the person was tested, may be increasing more slowly in the past few days than they have been since mid-August – but that would need confirming with more data, and there’s no sign yet of the increase actually turning into a decrease.
“I should mention that these high rates of testing positive won’t lead to the numbers of hospital admissions or deaths that we saw during previous waves, before vaccines had changed the way the disease behaves. Yesterday’s vaccine surveillance report1 from PHE confirms that vaccines remain pretty effective against severe disease.
“This week ONS have published their estimates of the incidence rate – the daily rate of new infections. So far I’ve been discussing the prevalence rate – the rate of testing positive, whether the infection has just begun or has been present for a few days or even a couple of weeks. The incidence rate estimates were not published last week. As always, for technical reasons the latest incidence rate estimates are for an earlier week than the latest prevalence figure – this week, the latest incidence figures are for the week 14-20 August. ONS report increases in Wales and in Scotland for that week, a level trend in England, and the trend in Northern Ireland is uncertain. That does broadly match the trends in new confirmed cases on the dashboard at the same time. The margins of statistical error for incidence estimates are inevitably higher than for prevalence estimates, because of the way the estimates are constructed. But adding up the central ONS estimates of prevalence for the four UK countries gives an estimated 75,100 new infections daily for that week of 14-20 August, or 526,000 for the whole week. That’s more than the population of Sheffield, or the population of every town and city in Scotland except Glasgow. It’s more than the population of the every town and city in Wales, and every town and city in Northern Ireland except greater Belfast (taken as a single conurbation). And that was three weeks ago, and confirmed cases on the dashboard have gone up a bit since then. It’s also worth pointing out that, for the week 14-20 August, there were about 228,000 new confirmed cases on the dashboard (measured by the testing date). The ONS incidence estimate for that week is more than double that figure – the difference must be, to a considerable extent, accounted for by infected people with no symptoms not being tested, and so not being recorded as new confirmed cases, and possibly also be people who do have some symptoms not being tested. But newly infected people are mostly capable of passing the infection to others, whether they are recorded as a new confirmed cases or not.
“Turning back from the incidence rates to the prevalence rates, I’ll look at the rates for individual regions and age groups in England. There are substantial differences between the regions of England in infection rates, with an estimated 1 in 45 testing positive in the North East, 1 in 90 (so about half the rate) in the East of England and 1 in 85 in the North West, London, and the South East, and others in between. However, because the number of people sampled in a single region is obviously a lot smaller than for the whole of England, these estimates have quite large margins of error. That’s particularly true of the North East region, because it has the smallest population of any of the English regions and, because of the way the sample is chosen, it has the smallest number of people being swabbed for the survey. The margin of error for the North East goes from 1 in 40 to 1 in 60. But ONS do consider that the rate of testing positive increased in the North East compared to the previous week, and decreased in the North West, though trends in the other regions are either ‘uncertain’ or ‘level’. Some of these estimated regional trends to tend to vary quite a lot from week to week, which might be just because of the statistical variability of results from a survey, or might be because a single large outbreak in a region can make the pattern look very different from one week to the next.
“For the most recent week, ONS estimate that rates of testing positive increased in England in the two youngest age groups that they use (from age 2, the lowest age included, right through to school year 11, age 16 or 17). Above that, they report evidence of a decrease of infection in those aged 25-34 and 50-69, but ONS consider the trends in other age groups to be uncertain. However, the rates of positivity in age groups up to 24 years do remain a lot higher than in older people, with an estimated 1 in 50 testing positive from age 2 up to the end of primary school, and 1 in 35 for the two age groups from the start of secondary school to age 34. For those aged 70 and over, the rate is only 1 in 170.
https://www.ons.gov.uk/releases/coronaviruscovid19infectionsurveyuk10september2021
All our previous output on this subject can be seen at this weblink:
www.sciencemediacentre.org/tag/covid-19
Declared interests
Prof Kevin McConway: “I am a Trustee of the SMC and a member of its Advisory Committee. I am also a member of the Public Data Advisory Group, which provides expert advice to the Cabinet Office on aspects of public understanding of data during the pandemic. My quote above is in my capacity as an independent professional statistician.”
None others received.