

select search filters
briefings
roundups & rapid reactions
Fiona fox's blog
The government have released the latest statistics from the COVID-19 Test and Trace system.
Prof Sheila Bird, Formerly Programme Leader, MRC Biostatistics Unit, University of Cambridge, said:
“During the 1st wave of SARS-CoV-2 infections, statisticians (including me) bemoaned that swab-tests and persons-swab-tested had not been disaggregated and, because limitations on access to testing were gradually being lifted, week-on-week comparisons were not necessarily like-with-like: they needed at least to be differentiated by gender and age-group so that gender and age-specific positive rates could be compared week-on-week.
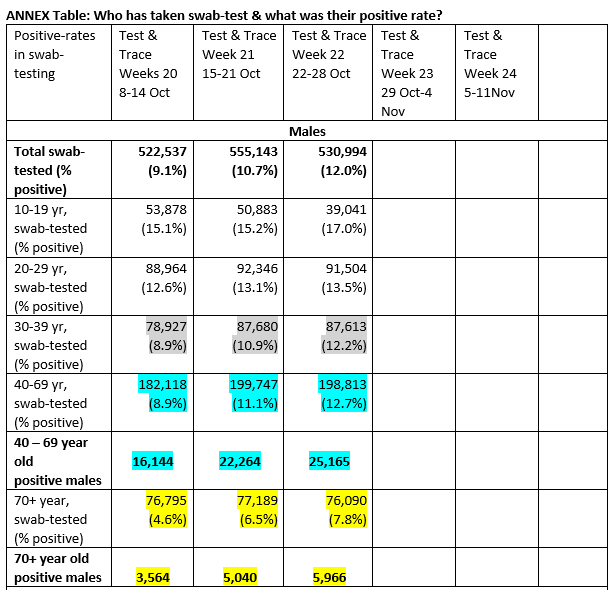
“As we enter UK’s second wave of COVID-19 cases, my ANNEX Table shows the massive improvement in transparency about interpretable swab-test results that has been achieved once the number who access swab-testing per week had risen to around half a million.
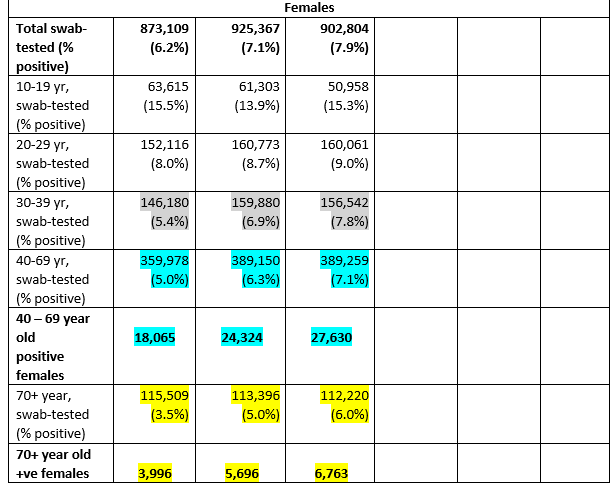
“In the most recent three weeks, just under twice as many females accessed testing as did males of similar age within 20-69 years but males’ swab-positive-rates are notably higher. Hence, at 40-69 years, 70,000 females tested positive during 8-28 October versus 63,600 males (nearest hundred). At age 70+ years, swab-tested males again had moderately higher positive-rates, but lower numbers tested, than for females. In this senior age-group, women outnumber men in the population anyway During 8-28 October, the 70+ age-group accounted for 16,500 swab-positive females versus 14,600 males (nearest 100).
“Swab-positive rates have increased only modestly between weeks 20 and 22 for 10-19 year olds (eg males: 15% to 17%) and 20-29 years olds (eg females: 8% to 9%) whereas they increased more dramatically at 40-69 years (eg males: 9% to 13%) and 70+ years (eg males: 4.6% to 7.8%). Over the weeks of Test & Trace, the statistician-team at DHSC has provided a comprehensive set of tables on test-turn-around times which demonstrated increased efficiency by laboratories but, subsequently, evidence of overload has appeared as the numbers who accessed testing increased by a factor of three from less than half a million to nearly 1.5 million per week; and positive cases transferred to Test & Trace have increased (to nearest 100) from a nadir of around 4,800 in week 11 (which ended on the glorious 12th August) to nearly 140,000 in week 22.
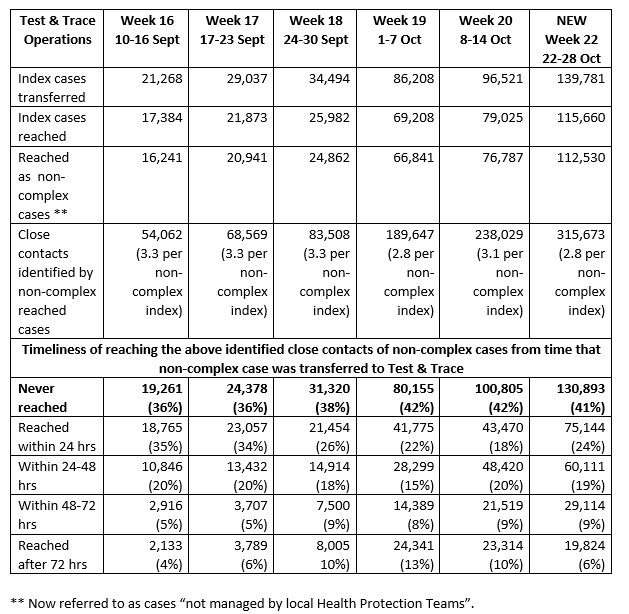
“Several operational aspects that have not fared well under the pressure of 30-fold increase work-load for tracers. Overall, around 81% of positive persons transferred to Test & Trace have been reached; and 82% of those reached have provided details for one or more close contacts. The number of close contacts identified has varied, see Table for recent trajectory. Overall, 67% of identified close contacts were reached . . . Identified close contacts of non-complex index cases are either household contacts or external close contacts: overall, 67% were household contacts, 57% of whom were asked to self-isolate whereas the self-isolation request was made to 65% of external close contacts overall.
“Test & Trace reports on the timeliness of its reaching identified contacts of non-complex cases: measured from the time the index case was transferred to Test & Trace. My Table for six of the seven most recent past weeks (16-20; then 22) includes identified contacts who were never reached! It is sobering to observe that the “never reached” identified contacts, once equalled the number of those reached within 24 hours but currently outnumber them nearly 2:1 (1.74: 1 in week 22). In week 22, 43% of identified contacts were reached within 48 hours of the index case having been transferred to Test & Trace, which is an improvement on weeks 19 and 20 when the proportion was below 40%.
Of course, measurement should really start from the date of symptom-onset in the index case which could add a further 48 hours . . .
Prof Kevin McConway, Emeritus Professor of Applied Statistics, The Open University, said:
“The point of any contact tracing system is to break chains of infection. That’s complicated because it involves several different stages. First, infected people have to be identified, and with Covid-19 that’s done by testing. Then they have to be advised to self-isolate, and they have to be reached and asked for details of people they have contacted and might possibly have infected. Then the contact tracers have to reach these contacts, and advise them in turn to self-isolate so that they are not out in the community potentially passing the infection on. And then the original infected people, and their contacts, actually do have to self-isolate, and for many of them that could require support of various sorts. And all this has to happen quickly enough so that any contacts can start self-isolating, if possible, before they have become infectious themselves. No system can be perfect – not every contact will be identified or reached, and not everyone will follow every detail of the self-isolation rules. But it doesn’t have to be perfect – just good enough.
“There’s some fairly good news about the operation of the system in England in this week’s Test and Trace statistics, though I still don’t think it’s working well enough. The latest week that the statistics cover goes from 22-28 October. I’ve been particularly concerned about the time it has taken in recent weeks to get from a person being identified as infected, to their contacts being identified and advised to self-isolate. That depends on the time it takes for the original person to get a test and then get the test results, the time it takes to reach them to ask about their contacts, and the time it takes to reach those contacts. On average, those times have shortened in the most recent week compared to the week before. The times taken between booking a test and getting the result have generally decreased this week compared to last, and last week they had decreased compared to the week before that. They aren’t down to the levels they were in July and August when there were far fewer people being infected, but they are considerably better than they were at the start of October. And, once a newly infected person is identified, the time it takes to identify and reach their contacts, and ask them to self-isolate, has reduced quite a lot in the most recent week compared to the week before. In the week before (15-21 October), under 30% of contacts were reached by the contact tracers within 24 hours of the original case, who identified them as contacts, being passed to the contact tracing part of the system. This week, that figure has gone up to about 40%. (This is for contacts not managed by local health protection teams – the performance figures for contacts managed by local health protection teams are generally a lot better, but these local teams manage under 4% of the contacts.) The percentage of contacts reached within 24 hours had been getting lower and lower from the start of September, when it was well over 50%, to last week, so it’s good to see that this decline seems to have at last been turned round. But the percentage is still not high enough. I’ll explain why.
“If it takes more than 24 hours for a contact to be reached, after the original case is transferred to the contact tracers, an infected contact might be out in the community, potentially passing the infection on further, before the contact even knows they might be infected. That’s because the contact might have met the original case a couple of days before the original case had symptoms and asked for a test (because people can be infectious before they have symptoms), then another day or more might pass between the original person booking a test and getting the result, and only after the result is available can the case be passed to the tracers. So it could be easily be three days after the contact met the case before the case can even be passed on to the contact tracers. Then if it takes more than a day for the contact to be reached, that might be five days or more after the contact met the case. On average, it takes around five days after infection before symptoms appear, and a person can be infectious to others a day or two before they have symptoms. Therefore, if it takes too long between the case being passed to the tracers and the contacts being reached, and if a contact was infected, they could have been walking round infecting others for a couple of days before they have even been told that they might be infected.
“I just hope that the new lockdown in England can provide a breathing space for the Test and Trace system so that its performance can continue to improve, because there’s still a long way to go.
“A more worrying aspect of this week’s Test and Trace statistics, but not a surprise, is that the number of positive cases identified by the system has continued to increase. No surprise because that’s generally in accord with other data sources. Those numbers have been increasing more slowly, week on week, in October than they did in September, which is encouraging, but they are definitely still increasing. I’d urge caution in reading too much into these figures on positive tests from Test and Trace, though. The number of positive tests depends on many things, including how many people were tested. This week that number wasn’t much different from the previous week, but what we can’t tell from these figures is what changes there might have been in the types of people tested – what symptoms (if any) they had, where they live, what jobs they do, whether they are in care homes, and so on. If any of those factors have changed much since the previous week, then that could have had an important effect on the number of people who tested positive. We’ll know much more about how the pattern of infection is changing across England when the latest results from the ONS infection survey are published tomorrow, because that tests a representative sample of people across the country.”
Prof James Naismith FRS FRSE FMedSci, Director of the Rosalind Franklin Institute, and University of Oxford, said:
“Until we have the ONS data tomorrow that cover last week, a definitive assessment on the efficiency of the system for last week is not possible. Based on what I see in this release I would not expect to change my previous assessment that system is not meaningfully impacting upon the disease.
“I note that the positivity rate in pillar 2 has gone above 10 %. Pillar 2 is testing the wider community. At above 5 % positivity, then daily test numbers run an increasing risk of underestimating the growth of the virus. This is well understood by scientists. It is notable that ONS (covering two weeks ago) and Nowcast (from Nov 3rd) data show a faster rate of spread of virus than the daily testing numbers do. I would strongly advise caution on solely relying on daily test numbers as a means to estimate the speed of the spread of the virus. It should be noted that the ZOE KCL model has shown show a stabilisation, ZOE is a new method, which does not mean that its wrong, just that it is less well tried and tested than the ONS methodology. Should ZOE be accurate then this would be very welcome news.
“I have no idea why, given the positivity in pillar 2, we are operating pillar 2 so far below the Government’s measure of capacity.”
All our previous output on this subject can be seen at this weblink:
www.sciencemediacentre.org/tag/covid-19
Declared interests
Prof Kevin McConway: “I am a Trustee of the SMC and a member of the Advisory Committee, but my quote above is in my capacity as a professional statistician.”
None others received.