

select search filters
briefings
roundups & rapid reactions
Fiona fox's blog
The government have released the latest statistics from the COVID-19 Test and Trace system.
Prof Sheila Bird, Formerly Programme Leader, MRC Biostatistics Unit, University of Cambridge, said:
“During the 1st wave of SARS-CoV-2 infections, statisticians (including me) bemoaned that swab-tests and person-swab-tested had not been disaggregated and, because limitations on access to testing were gradually being lifted, week-on-week comparisons were not necessarily like-with-like: they needed at least to be differentiated by gender and age-group so that gender and age-specific positive rates could be compared week-on-week.
“As we enter UK’s second wave of COVID-19 cases, my ANNEX Table shows the massive improvement in transparency about interpretable swab-test results that has been achieved once the number who access swab-testing per week had risen to around half a million. Roughly twice as many females access testing as do males of similar age within 20-69 years and males’ swab-positive-rates are notably higher, perhaps because males are more likely to have symptoms before they seek testing. Behavioural surveys may have better explanations. Exceptions are children (similar positive-rates by gender at 10-19 years) and 70+ year olds: males have moderately higher positive-rates despite lower numbers who access testing but, in this senior age-group, women outnumber men in the population anyway.
“More interesting in infection control terms is early evidence that the increase in swab-positive rate may have moderated by week 20 in the under 40s whereas in the age-groups most at risk of hospitalization for COVID-19 disease, the positive-rate continues to double fortnightly: for males aged 70+ years from 1.1% in week 16 to 2.3% in week 18 to 4.6% in week 20; for females aged 70+ years, up from 0.9% to 1.8% to 3.4% in week 20. By comparison, at 20-29 years, the corresponding swab-positive rates for males were 4.5%, 8.6%, 12.6% [not 17%] and for females were 2.4%, 5.2%, 8.0% [not 10%].
“Over the 20 weeks of Test & Trace, the statistician-team at DHSC has provided a comprehensive set of tables on test-turn-around times which demonstrated increased efficiency by laboratories but, subsequently, evidence of overload has appeared as the numbers who accessed testing increased by a factor of three from less than half a million to nearly 1.5 million per week; and positive cases transferred to Test & Trace have increased (to nearest 100) as follows: 8100 in week 1 through 3,600 and 4,800 in weeks 6 and 11 to 21,300 in week 16 and 96,500 in week 20. Hence, the workload for Test & Trace has increased 20-fold since the Glorious 12th August (end of week 11).
“Test & Trace has monitored, for example, the median age of people tested/tested positive which ranged from 50/55 years in week 1 to 46/45 years in week 6 to 44/36 years in week 11 to 40/35 years in week 16 and 41/33 years in week 20. Also reported are the 90th/95th percentile for the distance travelled for all in-person tests which ranged from 16.4/21.1 miles in week 1 through 13.9/18.1 miles and 14.3/19.7 miles in weeks 6 and 11 but up to 22.9/36.0 miles in week 16 after which there was clear improvements back down to 11.8/16 miles in week 20. An operational success scored by Test & Trace.
“Other operational aspects have fared less well under the pressure of 20-fold increase work-load for tracers. Overall, 80% of positive persons transferred to Test & Trace have been reached (81% in week 20); and 80% of those reached have provided details for one or more close contacts (85% in week 20). The number of close contacts identified has varied (nearest 100) from 55,100 in week 1, down to 14,100 and 17,400 in weeks 6 and 11 but increased sharply to 86,700 by week 16 and 251,600 in week 20, a 14-fold increase since the Glorious 12th August. Overall, 70% of identified close contacts were reached . . . but only 60% in week 20. Identified close contacts of non-complex index cases are either household contacts or external close contacts. Overall, of 856,000 (nearest 100) close contacts of non-complex index cases, 67% were household contacts (72% in week 20), 57% of whom were asked to self-isolate (56% in week 20) whereas the self-isolation request was made to 65% of external close contacts overall (63% in week 20).
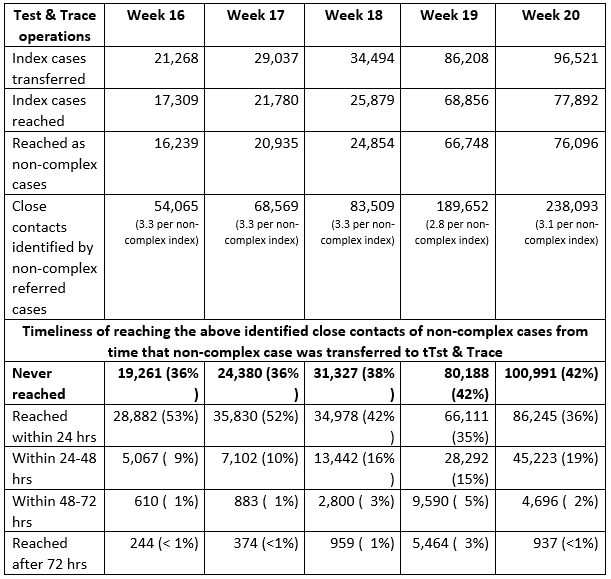
“Finally, Test & Trace reports on the timeliness of its reaching identified contacts of non-complex cases. Time-clock starts when the index case is transferred to Test & Trace. My table for the past 5 weeks includes identified contacts who were never reached: and is a sobering reflection.
ANNEX Table: Who has taken swab-test & what was their positive rate?

Prof James Naismith FRS FRSE FMedSci, Director of the Rosalind Franklin Institute, and University of Oxford, said:
“Today’s track and trace numbers up to 14th October show a system struggling to make any difference to the epidemic.
“The positivity rate is 7 %, this indicates that we are underestimating the disease (WHO targets is < 5 %).
“The ONS survey tomorrow will provide good evidence on these missing positives.
“The previous week’s ONS and track trace data data showed only about 50 % of cases were detected in this track and trace system.
“In the previous track trace report around 12, 000 people did not enter the tracing system, the cumulative total is now 17, 000.
“Roughly 19, 000 people who tested positive in the week to 14th Oct were not reached, so no contacts were provided.
“Each person contacted identified on average 3.2 people. For non-complex cases just over half (57 %) were reached.
“The proportion of contacts in the same household, is over 70 %. We have no idea if this accurate. The value of the system will really be in the non household contacts who are infectious, asymptomatic but are reached and isolate as a result. I worry the increasing % of household contacts indicates a tick box system rather than a proper tracing. Tracing is a highly skilled profession.
“We do not have any measure of the effectiveness of isolation.
“In summary, the current system indicates that around 2/3 of infected people do not have contacts traced at all.
“Of the contacts provided around 60 % of the contacts are reached.
“Of those that are reached, over 70 % of them are in the same house as the positive case, so were unlikely to have needed the tracing system.
“Only half of all contacts that are actually traced are reached within 24 hrs.
“These statistics are a stark demonstration of what SAGE concluded and we can see with our eyes, the system has given a birds eye view of the pandemic and done very little to halt it.
“It is for politicians to decide what to do about this.
“I would caution that new faces or more effort may sound attractive. However, getting an effective system over the summer was much easier than doing so now. It is not enough to say “we will work harder” or “I alone can fix it”. If the system is to be made effective, and I have my doubts if this now possible, it will need a clear set of plans that explain what changes are being made and how these will fill the in holes that I (and many others) have spelt out.”
Dr Joshua Moon, research fellow in the Science Policy Research Unit (SPRU) at the University of Sussex Business School, says:
“A 7.1% positivity rate is worrying, but could be due to a number of factors.
“Increased community transmission of the virus is the first and most obvious or immediate explanation.
“Second, the sharp decline in testing capacity (or at least stated testing capacity) in September means more targeted testing which artificially increases testing positivity.
“Third, testing resources being targeted to hotspots also artificially increases testing positivity.
“Importantly, while it is likely to be a combination of all of these, the key piece of information here is that community transmission is increasing and a robust FTTIS system is needed to reduce this.”
Prof Kevin McConway, Emeritus Professor of Applied Statistics, The Open University, said:
“There is some good, or at any rate not too bad, news in the Test and Trace data for the latest week, 8-14 October. The number of people testing positive is still rising, but it seems to be rising a bit more slowly than in the past few weeks. It is still rising, 12% higher than the previous week, but the fact that its rising a bit more slowly might give a bit of hope that measures to contain the virus are starting to work. You have to be extremely cautious in interpreting trends like that, as measures of how the pandemic might be changing across the country, because the number of positive tests depends on how many tests were done and also, crucially, on who is being tested. The number of tests carried out has hardly changed from the previous week, but the people who come forward for testing, or are asked to test because of their job or because of local outbreaks, may have changed. We’ll know more tomorrow when the weekly results from the ONS Infection Survey come out – they aren’t affected by changes of the sorts I’ve just described.
“The general issue in interpreting the data applies particularly to the percentage, of people tested, who test positive. One can calculate this by dividing the number of people who tested positive in the week by the number of people tested in the week, and this week that figure looks high at 7.1% (on Pillars 1 and 2 combined), up from 6.3% in the previous week and 4.3% the week before that. But there are two snags. One is that, if some tests are targeted in areas, or in groups of people, where infection rates are known to be higher than average, the percentage of positive tests won’t properly reflect the position in the country as a whole. The second is more technical – to avoid issues of double (or triple or more) counting people who are tested more than once in the same week, the statisticians take measures so that everyone is counted only once. But these measures cannot deal with the count of all people tested, and the count of positive tests, in identical ways, and that’s another reason why the positivity rate in the Test and Trace data might not be a good reflection of the rate in the country as a whole. I’m pretty confident, based on this data releases, that the percentage of people in England, who are infected, has indeed gone up considerably since the previous week, but I really wouldn’t want to put an exact figure on this, without seeing tomorrow’s results from the ONS Infection Survey.
“There’s definitely bad news too. A lot of the discussion about how Test and Trace is working has concentrated on how many things have happened – how many tests were done, how many people who test positive are reached by Test and Trace, how many contacts they give, how many of the contacts are reached, and so on. But, arguably, the time taken for things to happen is even more important. The main point of contact tracing is to break chains of infection. It does this by getting people who might be infectious, because they were in contact with someone who tested positive, to self-isolate so that they won’t pass the infection on to others. The quicker this happens, the more effective it is. On average, I understand, it takes around 5 days, after someone is infected, before they have symptoms (if indeed they ever do have symptoms). But they are infectious to others for around two days before they have any symptoms, and the 5 days is only an average anyway so that some people will have symptoms in less than five days and could be infectious to others more quickly. (Others will take much longer to show symptoms and to become infectious, which is why the self-isolation period for contacts is as long as 14 days after their contact with the person who originally tested positive.)
“But a lot has to happen, after a potentially infectious contact, before Test and Trace can reach the contacted person and advise them to self-isolate. The contact, when they might have become infected, quite probably took place before the person that they caught the infection from even knew they had symptoms. So there was probably an unavoidable delay before that person noticed symptoms and asked to be tested. Then that person has to book a test, get tested, and wait for a result. Their positive test result has to be transferred to the tracing part of Test and Trace, who then have to contact the person who tested positive, find out who their contacts were, get in touch with those contacts, and advise them to self-isolate.
“The bad news, this week, is that (at least) two aspects of that chain of events seem to be taking longer. The average time between booking a test and getting the result has increased quite a lot, just in one week. For tests in person, in the most recent week, around half took over 48 hours between booking the test and getting the results. The week before, it was about a fifth. For tests at home, or so-called ‘satellite tests’, where Test and Trace deliver tests to people rather than people being tested in person in Test and Trace testing facilities, times have not got worse this week, but are already much longer than for the in-person tests. (Satellite tests are mostly in care homes, and there are a lot of them – around 42% of all the tests carried out in Pillar 2. Three-quarters of them have a time of over 48 hours between when the test is carried out and when the results are received.)
“And the typical time between when a positive test result is transferred to Test and Trace for contact tracing, and a contacted person is reached and told to self-isolate, has been going up for some weeks and that increase continued in the most recent week. In mid-September, more than half the contacts, who were reached, were reached within 24 hours of the original positive case being transferred to Test and Trace. Now it’s only about a third who are reached within 24 hours.
“These increases in times to carry out the testing and the tracing inevitably mean that more people, who are potentially infectious and should already be self-isolating, are walking around, potentially infecting people, probably without even knowing that they are at higher risk of being infectious. This really isn’t good enough. I don’t know what is actually causing these extra delays – the statistical bulletin doesn’t really give much of a clue. But, whatever the reasons are, they need to be dealt with.”
All our previous output on this subject can be seen at this weblink:
www.sciencemediacentre.org/tag/covid-19
Declared interests
Prof Kevin McConway: “I am a Trustee of the SMC and a member of the Advisory Committee, but my quote above is in my capacity as a professional statistician.”None received.